Concept explainers
Videos
To estimate: The phylogeny of the given taxa by plotting the changes on each of the possible unrooted trees and determine the tree with fewest evolutionary changes.
Introduction: Three species named 1, 2, and 3 are endemic to a group of islands. They all share a common ancestor named species 4. Species 4 serves as an out group. It has a huge
Explanation of Solution
Deoxyribonucleic acid consists of four nucleotides, these are: adenine (A), thymine (T), guanine (G), and cytosine(C). These nucleotides can be paired and labeled for the given condition as follows:
- GC - a
- AG - b
- GT - c
- AC -d
- AT - e
- TG - f
- CA - g
The data of the nucleotide bases at the ten sequenced sites in the given four species are as follows:
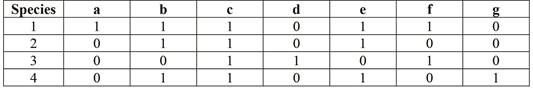
Pictorial representation: Fig.1, Fig.2 and Fig.3 represent the possible unrooted trees for phylogeny of the given taxa.
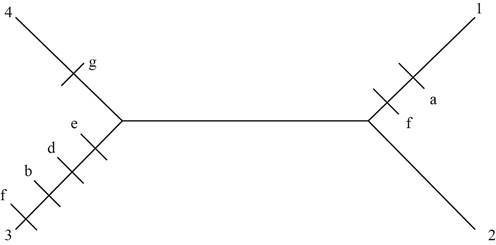
Fig 1: Seven changes observed in this unrooted tree
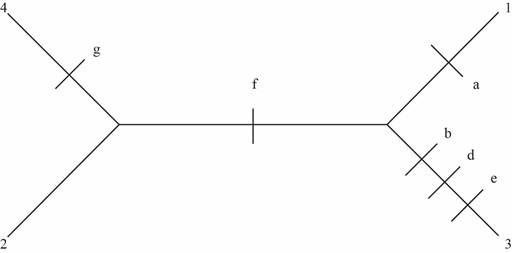
Fig 2: Six changes observed in this unrooted tree
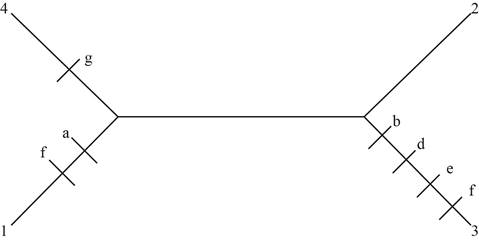
Fig 3: Seven changes observed in this unrooted tree
Therefore, the tree with fewest evolutionary changes is the second unrooted tree represented by Fig.2. This tree has only six changes, whereas the other two have seven changes which are higher than the second one.
Want to see more full solutions like this?
Chapter 2 Solutions
Evolution


- Species A, B, and C are related according to the phylogeny below (A,(B,C)). Species A and C diverged 10,000,000 generations ago, and species B and C diverged 100,000 generations ago. All three species are diploids. The mutation rate in their genomes is 1×10⁻⁹ mutations per basepair per generation. A gene found in all three species is 1,000 bp long. 75% of mutations in the gene are deleterious and 0% are beneficial. Use this information to answer the following questions. a) If there are 20 polymorphic synonymous sites in the gene in species A, how many non-synonymous sites do you expect to be polymorphic? Assume all synonymous changes are neutral. b) In species B, there are an average of two pairwise differences between individuals within the gene. What is the effective population size of species B? c) What do you expect FST to be between species B and C? Assume no migration between the species after they diverged.arrow_forwardSpecies A, B, and C are related according to the phylogeny below (A,(B,C)). Species A and C diverged 10,000,000 generations ago, and species B and C diverged 100,000 generations ago. All three species are diploids. The mutation rate in their genomes is 1×10⁻⁹ mutations per basepair per generation. A gene found in all three species is 1,000 bp long. 75% of mutations in the gene are deleterious and 0% are beneficial. Use this information to answer the following questions. a) Species A has 100,000 diploid individuals. How many new mutations arise per basepair per generation in species A? b) What is the gene’s neutral mutation rate per basepair per generation? c) What is the expected rate of fixation of neutral mutations in the gene? d) How many neutral substitution do you expect to observe if you compared the gene between species A and C?arrow_forwardImagine that you have the DNA sequences from the intron of a gene in three species called A, B, and C. Species A and B are most closely related, while C is more distantly related. The sequences of A and B differ by 18 base pairs, A and C differ by 26 base pairs, and B and C differ by 28 base pairs. Fossils show that species A and B diverged about 1.2 Mya, but there is no fossil evidence as to when the most recent common ancestor of all three species lived. (Draw a simple tree to help you think about the problem) Use the genetic data to estimate that date (most recent common ancestor). HINT = use Eqn 7.1, several times- first to estimate mutation rate. Then to estimate the unknown time since divergencearrow_forward
- Imagine that you have the DNA sequences from the intron of a gene in three species called A, B, and C. Species A and B are most closely related, while C is more distantly related. The sequences of A and B differ by 18 base pairs, A and C differ by 26 base pairs, and B and C differ by 28 base pairs. Fossils show that species A and B diverged about 1.2 Mya, but there is no fossil evidence as to when the most recent common ancestor of all three species lived. (Draw a simple tree to help you think about the problem) Use the genetic data to estimate that date (most recent common ancestor). What assumptions are you making to get this estimate?arrow_forwardAbout 3 million years ago, the Isthmus of Panama (a narrow strip of land connecting North and South America) formed, dividing marine organisms into Pacific and Caribbean populations. Researchers have examined species of snapping shrimp on both sides of the isthmus. Based on the morphological species concept, there appeared to be seven pairs of species, with one species of each pair in the Pacific and the other in the Caribbean. The different species pairs live at somewhat different depths in the ocean. Using mitochondrial DNA sequences, the researchers estimated phylogenies and found that each of these species pairs, separated by the isthmus were indeed each other's closest relatives. The researchers investigated mating in the lab and found that many species pairs were not very interested in courting with each other, and any that did mate almost never produced fertile offspring. Which process led to the formation of the species pairs of Pacific and Caribbean snapping shrimp? sympatric…arrow_forwardSuppose we are sure, because of previous studies, that species 1, 2, and 3 are more closely related to each other than to species 4 (outgroup). We sequence a gene and find ten nucleotide sites that differ among the four species. Draw the most parsimonious tree and label each evolutionary change on the tree (Position – new nucleotide; Example = 8T or 6C). *The answer is below but I do not understand where the numbers or tick marks came from? Could someone explain. For example, why is the 1A on the 2?arrow_forward
- About 3 million years ago, the Isthmus of Panama (a narrow strip of land connecting North and South America) formed, dividing marine organisms into Pacific and Caribbean populations. Researchers have examined species of snapping shrimp on both sides of the isthmus. Based on the morphological species concept, there appeared to be seven pairs of species, with one species of each pair in the Pacific and the other in the Caribbean. The different species pairs live at somewhat different depths in the ocean. Using mitochondrial DNA sequences, the researchers estimated phylogenies and found that each of these species pairs, separated by the isthmus were indeed each other's closest relatives. The researchers investigated mating in the lab and found that many species pairs were not very interested in courting with each other, and any that did mate almost never produced fertile offspring. Use the species concepts to explain how the sister populations on opposite sides of the isthmus are true…arrow_forwarda researcher studying two species (species 1 and species 2) sequences a short stretch of eight codons from the same gene, gene a, in each and compares them. species 1 and species 2 had a most recent common ancestor 50 million years ago. eight codons of nucleotide sequences are compared between species 1 and species 2. overall, there are six nucleotides that are different between the two species sequences. of these nucleotide differences, one is in the first position of a codon, three are in the second position of a codon, and two are in the third position of a codon. species 1 sequence is a t c, g g g, c g g, g a c, t t a, t t a, t a t, g c c. species 2 sequence is a a c, g g g, c g a, g a c, t a a, c t a, t a t, g g a. given the differences between the sequences of the two species' genes shown here, what evolutionary force can you predict is in operation on gene a? negative selection stabilizing selection balancing selection directional selection positive selection disruptive…arrow_forwardThree species are endemic to a group of islands and are all descended from species 4, a large population mainland species (it has no post-founder new mutations). Species 4 is the sister taxa of species 5, which is frugivorous. Species 1 and 3 are insectivorous and species 2 and 4 are frugivorous. The gene sequence of a 10-nucleotide locus for these species are: Species 1: GCTGATGAGT Species 2: ATCAATGAGT Species 3: GTTGCAACGT Species 4: GTCAATGACA Would it matter if this locus was under selection or selectively neutral; why or why not?arrow_forward
- A group of researchers are trying to determine the relationship between various groups of organisms. The researchers analyze the amino acid sequence of the protein cytochrome c in various groups of organisms. Once they sequence cytochrome c in all organisms, they determine the number of amino acid substitutions in each group. The results can be seen in the graph below, which plots the data with respect to the time since the divergence of the members of paired groups from a common ancestor. A B mammals and reptiles с Number of Amino Acid Substitutions (per 100 amino acids) in Cytochrome, c D 60- 50+ 40+ 30- 20+ 10+ 0 0 O birds and reptiles A graph showing when various groups of organisms diverged from a common ancestor Based on the graph above, can you conclude which of the following organisms are most distantly related? 200 400 600 800 1,000 Time Since Divergence from a Common Ancestor (millions of years) fish and land vertebrates mammals and reptiles birds and mammals insects and…arrow_forwardAsaparrow_forwardThe ancestor of cats was presumably homozygous for wild type at all of the described genes. What was the phenotype of this ancestral cat at each of these loci? 1)Dark grey with black mackerel stripes 2)Light grey female with dark grey mackerel stripes 3)Light brown male with chocolate tips 4)Black female with large white patches 5)Cream male with small white patches and orange mackerel stripes 6)A uniformly colored black catarrow_forward
 Human Anatomy & Physiology (11th Edition)BiologyISBN:9780134580999Author:Elaine N. Marieb, Katja N. HoehnPublisher:PEARSON
 Biology 2eBiologyISBN:9781947172517Author:Matthew Douglas, Jung Choi, Mary Ann ClarkPublisher:OpenStax
 Anatomy & PhysiologyBiologyISBN:9781259398629Author:McKinley, Michael P., O'loughlin, Valerie Dean, Bidle, Theresa StouterPublisher:Mcgraw Hill Education,
 Molecular Biology of the Cell (Sixth Edition)BiologyISBN:9780815344322Author:Bruce Alberts, Alexander D. Johnson, Julian Lewis, David Morgan, Martin Raff, Keith Roberts, Peter WalterPublisher:W. W. Norton & Company
 Laboratory Manual For Human Anatomy & PhysiologyBiologyISBN:9781260159363Author:Martin, Terry R., Prentice-craver, CynthiaPublisher:McGraw-Hill Publishing Co.
 Inquiry Into Life (16th Edition)BiologyISBN:9781260231700Author:Sylvia S. Mader, Michael WindelspechtPublisher:McGraw Hill Education