
Statistics for Business and Economics (13th Edition)
13th Edition
ISBN: 9780134506593
Author: James T. McClave, P. George Benson, Terry Sincich
Publisher: PEARSON
expand_more
expand_more
format_list_bulleted
Videos
Textbook Question
Chapter 14.6, Problem 14.37ACI
US school enrollments. The next table reports annual U S school enrollment (in thousands) for the period 1990-2014.
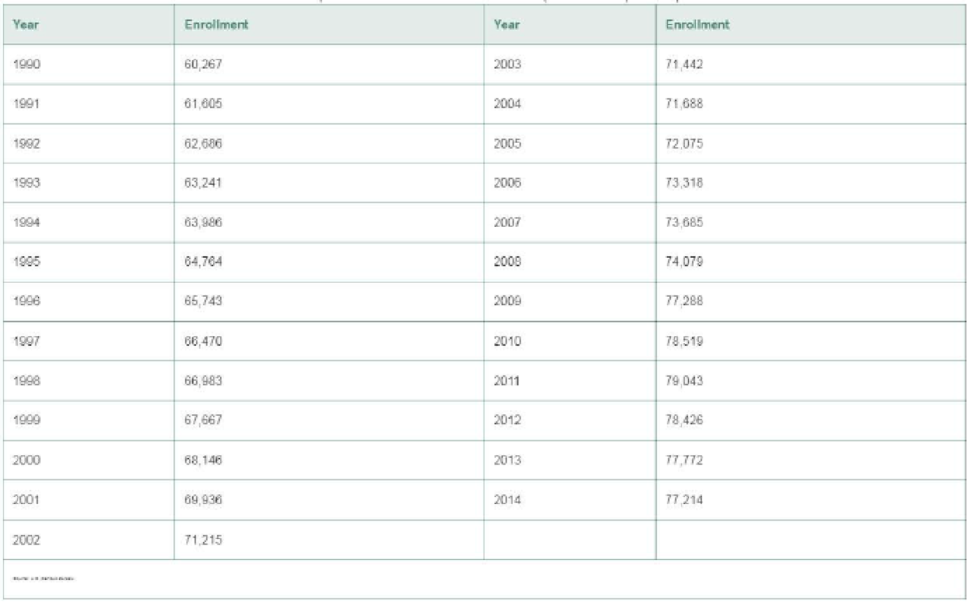
a. Use the 1990 to 2011 enrollments and simple exponential smoothing to forecast the 2012-2014 school enrollments. Use w = .8. 78,862.5
b. Use Holt’s method with w = .8 and v = .7 to forecast the 2012-2014 enrollments.
c. Apply the MAD, MAPE, and RMSE criteria to evaluate the two forecasting models of parts a and b. Which model is better? Why?
Expert Solution & Answer
Want to see the full answer?
Check out a sample textbook solution
Chapter 14 Solutions
Statistics for Business and Economics (13th Edition)
Ch. 14.1 - Explain in words how to construct a simple index.Ch. 14.1 - Explain in words how to calculate the following...Ch. 14.1 - Explain in words the difference between Laspeyres...Ch. 14.1 - The table below gives the prices for three...Ch. 14.1 - Refer to Exercise 14.4. The next table gives the...Ch. 14.1 - Annual median family income. The table below lists...Ch. 14.1 - Annual U.S. craft beer production. While overall...Ch. 14.1 - Quarterly single-family housing starts. The...Ch. 14.1 - Spot price of natural gas. The table shown in the...Ch. 14.1 - Employment in farm and nonfarm categories....
Ch. 14.1 - GOP personal consumption expenditures. The gross...Ch. 14.1 - GDP personal consumption expenditures (contd)....Ch. 14.1 - Weekly earnings for workers. The table in the next...Ch. 14.1 - Production and price of metals. The level or price...Ch. 14.2 - Describe the effect of selecting an exponential...Ch. 14.2 - A monthly time series is shown in the table to the...Ch. 14.2 - Annual U.S. craft beer production. Refer to the...Ch. 14.2 - Foreign fish production. Overfishing and pollution...Ch. 14.2 - Yearly price of gold. The price of gold is used by...Ch. 14.2 - Personal consumption in transportation. There has...Ch. 14.2 - OPEC crude oil imports. The data in the table...Ch. 14.2 - SP 500 Stock Index. Standard Poors 500 Composite...Ch. 14.5 - How does the choice of the smoothing constant w...Ch. 14.5 - Refer to Exercise 14.4 (p. 14-9). The table with...Ch. 14.5 - Annual U.S. craft beer production. Refer to...Ch. 14.5 - Quarterly single-family housing starts. Refer to...Ch. 14.5 - Consumer Price Index. The CPI measures the...Ch. 14.5 - OPEC crude oil imports. Refer to the annual OPEC...Ch. 14.5 - SP 500 Stock Index. Refer to the quarterly...Ch. 14.5 - SP 500 Stock Index (contd). Refer to Exercise...Ch. 14.5 - Monthly gold prices. The fluctuation of gold...Ch. 14.6 - Annual U.S. craft beer production. Refer to the...Ch. 14.6 - Annual U.S. craft beer production (contd). Refer...Ch. 14.6 - SP 500 Stock Index. Refer to your exponential...Ch. 14.6 - SP 500 Stock Index (contd). Refer to your Holt...Ch. 14.6 - Monthly gold prices. Refer to the monthly gold...Ch. 14.6 - US school enrollments. The next table reports...Ch. 14.8 - The annual price of a finished product (in cents...Ch. 14.8 - Retail sales in Quarters 14 over a 10-year period...Ch. 14.8 - What advantage do regression forecasts have over...Ch. 14.8 - Mortgage interest rates. The level at which...Ch. 14.8 - Price of natural gas. Refer to Exercise 14.9 (p....Ch. 14.8 - A gasoline tax on carbon emissions. In an effort...Ch. 14.8 - Predicting presidential elections. Researchers at...Ch. 14.8 - Life insurance policies in force. The table below...Ch. 14.8 - Graphing calculator sales. The next table presents...Ch. 14.8 - Prob. 14.47ACICh. 14.9 - Define autocorrelation. Explain why it is...Ch. 14.9 - For each case, indicate the decision regarding the...Ch. 14.9 - What do the following Durbin-Watson statistics...Ch. 14.9 - Company donations to charity. Refer to the Journal...Ch. 14.9 - Forecasting monthly car and truck sales. Forecasts...Ch. 14.9 - Predicting presidential elections. Refer to the...Ch. 14.9 - Mortgage interest rates. Refer to the data on...Ch. 14.9 - Price of natural gas. Refer to the annual data on...Ch. 14.9 - Life insurance policies in force. Refer to the...Ch. 14.9 - Modeling the deposit share of a retail bank....Ch. 14 - Insured Social Security workers. Workers insured...Ch. 14 - Insured Social Security workers (contd). Refer to...Ch. 14 - Retail prices of food items. In 1990, the average...Ch. 14 - Demand for emergency room services. With the...Ch. 14 - Mortgage interest rates. Refer to the annual...Ch. 14 - Price of Abbott Labs stock. The yearly closing...Ch. 14 - Price o f Abbott Labs stock (contd). Refer to...Ch. 14 - Prob. 14.65ACICh. 14 - Prob. 14.66ACICh. 14 - Quarterly GOP values (contd). Refer to Exercise...Ch. 14 - Prob. 14.68ACICh. 14 - Prob. 14.69ACICh. 14 - Prob. 14.70ACICh. 14 - IBM stock prices. Refer to Example 14.1 (p. 14-5)...Ch. 14 - Prob. 14.72ACI
Knowledge Booster


Learn more about
Need a deep-dive on the concept behind this application? Look no further. Learn more about this topic, statistics and related others by exploring similar questions and additional content below.Similar questions
- Enter the data from Table 2 into a graphing calculator and graph the ranking scatter plot. Determine whetherthe data from the table would likely represent a function that is linear, exponential, or logarithmic.arrow_forwardTable 6 shows the year and the number ofpeople unemployed in a particular city for several years. Determine whether the trend appears linear. If so, and assuming the trend continues, in what year will the number of unemployed reach 5 people?arrow_forwardDoes a linear, exponential, or logarithmic model best fit the data in Table 2? Find the model.arrow_forward
- Explain why the values of an increasing exponentialfunction will eventually overtake the valuesof anincreasing linear function.arrow_forwardWhat might a scatterplot of data points look like if it were best described by a logarithmic model?arrow_forwardIs carbon dating? Why does it work? Give an example in which carbon dating would be useful.arrow_forward
- Printer Failure The lifetime of a printer costing 200 is exponentially distributed with mean of 2 years. The manufacturer agrees to pay a full refund to a buyer if the printer fails during the first year following its purchase, and a one-half refund if it fails during the second year. If the manufacture sells 100 printers, how much should it expect to pay in refunds? Choose one of the following. Source: Society of Actuaries. a. 6321 b. 7358 c. 7869 d. 10256 e. 12642arrow_forwardWhat does the y -intercept on the graph of a logistic equation correspond to for a population modeled by that equation?arrow_forward
arrow_back_ios
arrow_forward_ios
Recommended textbooks for you
 Calculus For The Life SciencesCalculusISBN:9780321964038Author:GREENWELL, Raymond N., RITCHEY, Nathan P., Lial, Margaret L.Publisher:Pearson Addison Wesley,
 Algebra & Trigonometry with Analytic GeometryAlgebraISBN:9781133382119Author:SwokowskiPublisher:Cengage
 Big Ideas Math A Bridge To Success Algebra 1: Stu...AlgebraISBN:9781680331141Author:HOUGHTON MIFFLIN HARCOURTPublisher:Houghton Mifflin Harcourt
 College Algebra (MindTap Course List)AlgebraISBN:9781305652231Author:R. David Gustafson, Jeff HughesPublisher:Cengage Learning
 Glencoe Algebra 1, Student Edition, 9780079039897...AlgebraISBN:9780079039897Author:CarterPublisher:McGraw Hill
Calculus For The Life Sciences
Calculus
ISBN:9780321964038
Author:GREENWELL, Raymond N., RITCHEY, Nathan P., Lial, Margaret L.
Publisher:Pearson Addison Wesley,
Algebra & Trigonometry with Analytic Geometry
Algebra
ISBN:9781133382119
Author:Swokowski
Publisher:Cengage
Big Ideas Math A Bridge To Success Algebra 1: Stu...
Algebra
ISBN:9781680331141
Author:HOUGHTON MIFFLIN HARCOURT
Publisher:Houghton Mifflin Harcourt
College Algebra (MindTap Course List)
Algebra
ISBN:9781305652231
Author:R. David Gustafson, Jeff Hughes
Publisher:Cengage Learning
Glencoe Algebra 1, Student Edition, 9780079039897...
Algebra
ISBN:9780079039897
Author:Carter
Publisher:McGraw Hill
Time Series Analysis Theory & Uni-variate Forecasting Techniques; Author: Analytics University;https://www.youtube.com/watch?v=_X5q9FYLGxM;License: Standard YouTube License, CC-BY
Operations management 101: Time-series, forecasting introduction; Author: Brandoz Foltz;https://www.youtube.com/watch?v=EaqZP36ool8;License: Standard YouTube License, CC-BY