
Statistics for Business and Economics (13th Edition)
13th Edition
ISBN: 9780134506593
Author: James T. McClave, P. George Benson, Terry Sincich
Publisher: PEARSON
expand_more
expand_more
format_list_bulleted
Videos
Textbook Question
Chapter 14.2, Problem 14.22ACI
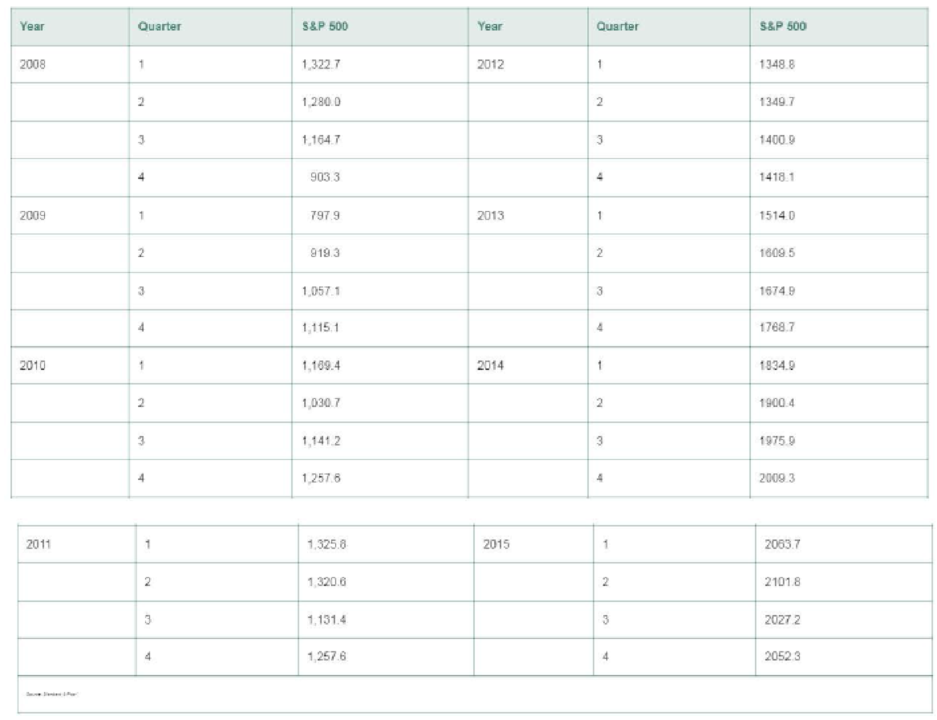
S&P 500 Stock Index. Standard & Poor’s 500 Composite Stock Index (S&P 500) is a stock market index. Like the Dow Jones Industrial Average, it is an indicator of stock market activity. The data in the table are end-of-quarter values of the S&P 500 for the years 2008-2015.
a. Calculate and plot the exponentially smoothed series for the quarterly S&P 500 using a smoothing constant of w = .3.
b. Repeat part a but use w = .7.
c. Which exponentially smoothed series do you prefer for describing trends in the series? Explain.
Expert Solution & Answer
Want to see the full answer?
Check out a sample textbook solution
Students have asked these similar questions
c. Predict sales in 15 years.
If You have this information about return of stock in 3 periods:
-12%, 20% and 25%.
calculate:
The arithmetic average.
The geometric average.
The rate of return for the last 19 years of a certain segment of the stock market is given in the table.
(The data is also provided below the table as a comma-separated list to make it easier to copy.)
Market Segment Rate of
Return, 2002-2020
Year
Rate of Return (%)
2020
3.23
2019
6.14
2018
11.39
2017
15.99
2016
3.24
2015
-3.86
2014
-1.04
2013
8.49
2012
5.93
2011
6.96
2010
1.98
2009
3.13
2008
-6.55
2007
7.27
2006
3.02
2005
-1.34
2004
7.28
2003
6.27
2002
-0.76
Rate of Return (%):
3.23, 6.14, 11.39, 15.99, 3.24, -3.86, -1.04, 8.49, 5.93, 6.96, 1.98, 3.13, -6.55, 7.27, 3.02, -1.34, 7.28,
6.27, -0.76
Find the 34th percentile of the data.
6.46
Chapter 14 Solutions
Statistics for Business and Economics (13th Edition)
Ch. 14.1 - Explain in words how to construct a simple index.Ch. 14.1 - Explain in words how to calculate the following...Ch. 14.1 - Explain in words the difference between Laspeyres...Ch. 14.1 - The table below gives the prices for three...Ch. 14.1 - Refer to Exercise 14.4. The next table gives the...Ch. 14.1 - Annual median family income. The table below lists...Ch. 14.1 - Annual U.S. craft beer production. While overall...Ch. 14.1 - Quarterly single-family housing starts. The...Ch. 14.1 - Spot price of natural gas. The table shown in the...Ch. 14.1 - Employment in farm and nonfarm categories....
Ch. 14.1 - GOP personal consumption expenditures. The gross...Ch. 14.1 - GDP personal consumption expenditures (contd)....Ch. 14.1 - Weekly earnings for workers. The table in the next...Ch. 14.1 - Production and price of metals. The level or price...Ch. 14.2 - Describe the effect of selecting an exponential...Ch. 14.2 - A monthly time series is shown in the table to the...Ch. 14.2 - Annual U.S. craft beer production. Refer to the...Ch. 14.2 - Foreign fish production. Overfishing and pollution...Ch. 14.2 - Yearly price of gold. The price of gold is used by...Ch. 14.2 - Personal consumption in transportation. There has...Ch. 14.2 - OPEC crude oil imports. The data in the table...Ch. 14.2 - SP 500 Stock Index. Standard Poors 500 Composite...Ch. 14.5 - How does the choice of the smoothing constant w...Ch. 14.5 - Refer to Exercise 14.4 (p. 14-9). The table with...Ch. 14.5 - Annual U.S. craft beer production. Refer to...Ch. 14.5 - Quarterly single-family housing starts. Refer to...Ch. 14.5 - Consumer Price Index. The CPI measures the...Ch. 14.5 - OPEC crude oil imports. Refer to the annual OPEC...Ch. 14.5 - SP 500 Stock Index. Refer to the quarterly...Ch. 14.5 - SP 500 Stock Index (contd). Refer to Exercise...Ch. 14.5 - Monthly gold prices. The fluctuation of gold...Ch. 14.6 - Annual U.S. craft beer production. Refer to the...Ch. 14.6 - Annual U.S. craft beer production (contd). Refer...Ch. 14.6 - SP 500 Stock Index. Refer to your exponential...Ch. 14.6 - SP 500 Stock Index (contd). Refer to your Holt...Ch. 14.6 - Monthly gold prices. Refer to the monthly gold...Ch. 14.6 - US school enrollments. The next table reports...Ch. 14.8 - The annual price of a finished product (in cents...Ch. 14.8 - Retail sales in Quarters 14 over a 10-year period...Ch. 14.8 - What advantage do regression forecasts have over...Ch. 14.8 - Mortgage interest rates. The level at which...Ch. 14.8 - Price of natural gas. Refer to Exercise 14.9 (p....Ch. 14.8 - A gasoline tax on carbon emissions. In an effort...Ch. 14.8 - Predicting presidential elections. Researchers at...Ch. 14.8 - Life insurance policies in force. The table below...Ch. 14.8 - Graphing calculator sales. The next table presents...Ch. 14.8 - Prob. 14.47ACICh. 14.9 - Define autocorrelation. Explain why it is...Ch. 14.9 - For each case, indicate the decision regarding the...Ch. 14.9 - What do the following Durbin-Watson statistics...Ch. 14.9 - Company donations to charity. Refer to the Journal...Ch. 14.9 - Forecasting monthly car and truck sales. Forecasts...Ch. 14.9 - Predicting presidential elections. Refer to the...Ch. 14.9 - Mortgage interest rates. Refer to the data on...Ch. 14.9 - Price of natural gas. Refer to the annual data on...Ch. 14.9 - Life insurance policies in force. Refer to the...Ch. 14.9 - Modeling the deposit share of a retail bank....Ch. 14 - Insured Social Security workers. Workers insured...Ch. 14 - Insured Social Security workers (contd). Refer to...Ch. 14 - Retail prices of food items. In 1990, the average...Ch. 14 - Demand for emergency room services. With the...Ch. 14 - Mortgage interest rates. Refer to the annual...Ch. 14 - Price of Abbott Labs stock. The yearly closing...Ch. 14 - Price o f Abbott Labs stock (contd). Refer to...Ch. 14 - Prob. 14.65ACICh. 14 - Prob. 14.66ACICh. 14 - Quarterly GOP values (contd). Refer to Exercise...Ch. 14 - Prob. 14.68ACICh. 14 - Prob. 14.69ACICh. 14 - Prob. 14.70ACICh. 14 - IBM stock prices. Refer to Example 14.1 (p. 14-5)...Ch. 14 - Prob. 14.72ACI
Knowledge Booster


Learn more about
Need a deep-dive on the concept behind this application? Look no further. Learn more about this topic, statistics and related others by exploring similar questions and additional content below.Similar questions
- Historical returns. Calculate the arithmetic average return of U.S. Treasury bills, long-term government bonds, and large-company stocks for 1988 to 1997. Which had the highest return? Which had the lowest return? On the left side, click on the Spreadsheet Leaming Aid to see Table 8.1-Year-by-Year Returns, 1950-1999. What is the average return of U.S. Treasury bills for 1988 to 1997? |% (Round to two decimal places.)arrow_forward. If a startup churns 5.6% of its customers each month, then what is the average lifetime of a customer in months? 15.9 (rounded) 17.9 (rounded) 19.9 (rounded)arrow_forwardDuring 2008 the S&P 500 indexm depreciated by 37.6%. Assuming that this trend has continued, how much would an $8,000 investment in an S&P index fund have been worth after 7 years? (round your answer to the nearest cent) $________arrow_forward
- Suppose that a firm's sales were $3,750,000 five years ago and are $5,250,000 today. What was the geometric mean growth rate in sales over the past five years?arrow_forwardSuppose the following table shows the approximate price of a certain stock in December of each year from 2005 through 2014, as well as the 4-year moving averages for 2005 through 2007.† Complete the table by computing the remaining 4-year moving averages. (Note the peak in 2007 and the drop in subsequent years.) Round each average to the nearest dollar. (Chart in picture)arrow_forwardSuppose the rate of return for a particular stock during the past two years was 10% and - 45%. Compute the geometric mean rate of return. The geometric mean rate of return is %. (Round to one decimal place as needed.)arrow_forward
- bank records the number of mortgage applications and its own prevailing interest rate (at the first of the month) for each of 16 consecutive months. The data is below Fine the best-fitting line for this data. Round your coefficients to 1 decimal place.arrow_forwarda. During 2008 the S&P 500 index depreciated by 37.6%.† Assuming that this trend had continued, how much would a $9,000 investment in an S&P index fund have been worth after 7 years? (Round your answer to the nearest cent.) b. You invest $10,000 in Rapid Growth Funds, which appreciate by 4% per year, with yields reinvested quarterly. By how much (in dollars) will your investment have grown after 4 years? (Round your answer to the nearest cent.)arrow_forwardThe table below shows the year open and year closing price of the S&P 500 Stock Index from 2005 to 2020: Year Year Open Year Close Annual Percent Change 2005 $ 1,202.08 $ 1,248.29 2006 $ 1,268.08 $ 1,418.30 2007 $ 1,416.60 $ 1,468.36 2008 $ 1,447.16 $ 903.25 2009 $ 931.80 $ 1,115.10 2010 $ 1,132.99 $ 1,257.64 2011 $ 1,271.87 $ 1,257.60 2012 $ 1,277.06 $ 1,426.19 2013 $ 1,462.42 $ 1,848.36 2014 $ 1,831.98 $ 2,058.90 2015 $ 2,058.20 $ 2,043.94 2016 $ 2,012.66 $ 2,238.83 2017 $ 2,257.83 $ 2,673.61 2018 $ 2,695.81 $ 2,506.85 2019 $ 2,510.03 $ 3,230.78 2020 $ 3,257.85 $ 3,756.07 Find the annual percent change for the S&P 500 from 2005 to 2020; (Put those values in the table above) Compute the mean,…arrow_forward
- Annualized percentage return on investment (as compared to the Standard & Poor's 500 Index) for 10 randomly selected stock screeners are reproduced in the table. Complete parts a through c.arrow_forward不 The data in the table represent the stock price for a company at the end of each month in 2015. (a) Construct a time-series plot and comment on any trends. (b) What was the percent change in the stock price of the company from January 2015 to December 2015? Date 1/15 2/15 3/15 4/15 5/15 6/15 7/15 8/15 9/15 10/15 11/15 12/15 Closing Price D 28.78 28.98 31.45 35.08 31.50 31.88 30.66 31.55 32.14 36.17 36.63 37.28 (a) Which of the following is a time-series plot of the data? OB. Closing Price Closing Price 40- Andrea Jan Jun Dec Month 251 40- 30- 25TTT Jan Jun Month Dec Q Closing Price Closing Price 40- 251TT Jan Jun Month Dec Jan Jun Dec Month Comment on any trends. Choose the correct answer below. OA. The stock price generally remained the same throughout the year. Q OB. The stock price generally decreased throughout the year. C. There was no discernible trend in the stock price throughout the year. D. The stock price generally increased throughout the year. (b) The percent change in…arrow_forwardb. Suppose that $250 is invested in an account that earns 5% annual interest. Find the amount money in the account after 20 years.arrow_forward
arrow_back_ios
SEE MORE QUESTIONS
arrow_forward_ios
Recommended textbooks for you
 MATLAB: An Introduction with ApplicationsStatisticsISBN:9781119256830Author:Amos GilatPublisher:John Wiley & Sons Inc
 Probability and Statistics for Engineering and th...StatisticsISBN:9781305251809Author:Jay L. DevorePublisher:Cengage Learning
 Statistics for The Behavioral Sciences (MindTap C...StatisticsISBN:9781305504912Author:Frederick J Gravetter, Larry B. WallnauPublisher:Cengage Learning
 Elementary Statistics: Picturing the World (7th E...StatisticsISBN:9780134683416Author:Ron Larson, Betsy FarberPublisher:PEARSON
 The Basic Practice of StatisticsStatisticsISBN:9781319042578Author:David S. Moore, William I. Notz, Michael A. FlignerPublisher:W. H. Freeman
 Introduction to the Practice of StatisticsStatisticsISBN:9781319013387Author:David S. Moore, George P. McCabe, Bruce A. CraigPublisher:W. H. Freeman
MATLAB: An Introduction with Applications
Statistics
ISBN:9781119256830
Author:Amos Gilat
Publisher:John Wiley & Sons Inc
Probability and Statistics for Engineering and th...
Statistics
ISBN:9781305251809
Author:Jay L. Devore
Publisher:Cengage Learning
Statistics for The Behavioral Sciences (MindTap C...
Statistics
ISBN:9781305504912
Author:Frederick J Gravetter, Larry B. Wallnau
Publisher:Cengage Learning
Elementary Statistics: Picturing the World (7th E...
Statistics
ISBN:9780134683416
Author:Ron Larson, Betsy Farber
Publisher:PEARSON
The Basic Practice of Statistics
Statistics
ISBN:9781319042578
Author:David S. Moore, William I. Notz, Michael A. Fligner
Publisher:W. H. Freeman
Introduction to the Practice of Statistics
Statistics
ISBN:9781319013387
Author:David S. Moore, George P. McCabe, Bruce A. Craig
Publisher:W. H. Freeman
Time Series Analysis Theory & Uni-variate Forecasting Techniques; Author: Analytics University;https://www.youtube.com/watch?v=_X5q9FYLGxM;License: Standard YouTube License, CC-BY
Operations management 101: Time-series, forecasting introduction; Author: Brandoz Foltz;https://www.youtube.com/watch?v=EaqZP36ool8;License: Standard YouTube License, CC-BY