Concept explainers
To review:
The changes in blood triglycerides, lactate, and succinate levels due to seasonal variations in relation to the changes in bears
Given:
Researchers took brown bears (Ursus arctos) for the study of gut microbiota in food digestion and in many other aspects of nutrition. Brown bears undergo hibernation in the drastic winters. Researchers study whether microbiome of the bear’s gut was different or not, before and after the fasting. For this, the blood along with the fecal sample from 16 free-ranging brown bears has taken during hibernation (February or March) and following hibernation (June) for further study. The fecal samples were analyzed for the presence of different microbe communities, while the blood was tested for triglycerides and other nutrients.
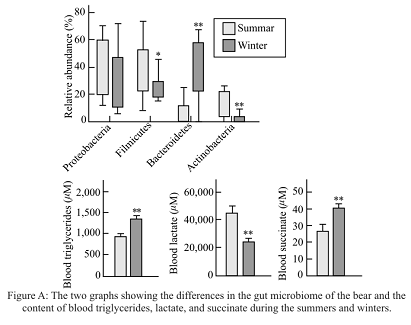
The graphs given below were plotted by the researchers after observing the conditions. Graph1 shows the presence of different composition of microbiome during different seasons. Also, the differences in the blood levels of triglycerides, lactate, and succinate are depicted.
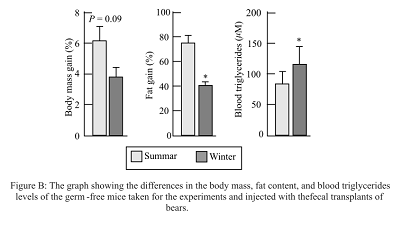
The researchers also examined the effects of these microbiota when introduced into germ-free mice. Germ-free mice, unlike normal mice are devoid of gut microbiota and are unable to gain mass when they are kept on a high-fat diet. Fecal transplants from summer or winter bears were given to the germ-free mice. Graph 2 shows the changes in body mass, fat content, and blood triglyceride levels of the mice after 2 weeks.

Graph 1: The two graphs showing the differences in the gut microbiome of the bear and the content of blood triglycerides, lactate, and succinate during the summers and winters.

Graph 2: The graph showing the differences in the body mass, fat content, and blood triglycerides level of the germ-free mice taken for the experiments and injected with the fecal transplants of bears.
Introduction:
Hibernation may be defined as the behavior of animals in unfavorable winters where they becomes inactive and sleeps for a particular interval of time. The animals do not eat during hibernation, thus, they use the stored fat to meet the energy requirements. Before the onset of hibernation, the animals keep on eating to increase their stored fat content.
Explanation of Solution
It was observed that the levels of blood triglycerides in bears were present in a higher amount in winters than summers. The bears undergo hibernation in winters and during hibernation, energy required by the body is obtained by the lipolysis (breakdown or oxidation of lipids) of the stored fat. Also, the lactate content in the body of bears was observed to be in lesser amounts during winters than in summers and the succinate (for gluconeogenesis) content of the body was higher in the winters.
The given data indicates that bears use mobilization and oxidation of lipids along with reduced glucose utilization and increased gluconeogenesis (generation of new glucose) as a survival strategy during hibernation. These strategies help the bears to cope up with the harsh winter environments.
Thus, it is concluded from the data that in bears, the blood triglycerides and succinate content were present in a higher amount in winters during hibernation as compared to summers while the lactate content was present in lower amounts in the winters. The difference in the content of all three components in summers and winters help the bears to cope up with harsh winters.
Want to see more full solutions like this?
Chapter 50 Solutions
Life: The Science of Biology
- At the conclusion of anaerobic glycolysis, a metabolite is formed (you should have mentioned this in part g of question 6 above) that is released into the general circulation. Briefly describe this process and the fate of this metabolite. What would be the expected difference in this metabolite between two individuals of differing fitness levels (e.g., one athlete has a higher VO2max than the other) during an exercise test?arrow_forwardSelect the correct answer: Lactate dehydrogenase (LDH) plays an essential role in an exercising muscle, especially when the level of excursion surpasses the ability of circulatory systems ability to supply adequate oxygen. What is the main reason LDH is so important to the muscle under these conditions? A)It removes excess lactic acid from the muscle to create pyruvate. B)It produces NADH for energy while converting pyruvate into lactate. C)It resupplies NAD+ to glyceraldehyde 3-phosphate dehydrogenase. D)It decreases pH thus decreasing the dissociation rate of oxygen from hemoglobin. E)It produces one mole of ATP via substrate level phosphorylation.arrow_forwardLactate dehydrogenase (LDH) plays an essential role in an exercising muscle, especially when the level of excursion surpasses the ability of circulatory systems ability to supply adequate oxygen. What is the main reason LDH is so important to the muscle under these conditions? It produces one mole of ATP via substrate level phosphorylation. It resupplies NAD+ to glyceraldehyde 3-phosphate dehydrogenase. It decreases pH thus decreasing the dissociation rate of oxygen from hemoglobin It produces NADH for energy while converting pyruvate into lactate. It removes excess lactic acid from the muscle to create pyruvate. Nextarrow_forward
- Which of the following statements is true? In general, the metabolic oxidation of protein in mammals is less efficient, in terms of energy conserved, than the metabolic oxidation of carbohydrate or fat. Given that the nitrogen of glutamate can be redistributed by transamination, glutamate should be a good supplement for nutritionally poor proteins. Both A and B Neither A nor B Which of the following leads to an increase in blood glucose levels? Activation of insulin-receptor substrates (IRSs) Phosphorylation of glycogen synthase kinase 3 (GSK3) Increased levels of PIP3D. Activation of protein kinase B (PKB) All of the above None of the abovearrow_forwardWhich one of the following statements concerning disorders of muscle metabolism presented in class is incorrect? a) Mutations in animals can spread rapidly because of line breeding to prolific males. b) The low rate of metabolism and ATP consumption in muscle and nerve makes effects of mitochondrial myopathies less observable in these tissues. c) Glycogen storage diseases resulting from mutations in glycolytic and glycogen pathway genes typically cause accumulation of abnormal glycogen and/or exercise intolerance. d) Lipid storage myopathies can result from deficiencies in enzymes of Beta-oxidation and lead to the accumulation of triglyceride droplets in muscle fibers. .arrow_forward5. There is an expression: diabetes mellitus is «hunger among abundance. What metabolic changes in diabetes confirm the validity of this statement? For answer: 9.8. Metabolic Changes in Diabetes Mellitus 535 a) list the main causes of metabolic changes in IDDM; b) enumerate the tissues with the main energy sources metabolism procceding according to this type of starvation; c) name the metabolic pathways that are activated and inhibited in these tissues, and explain why; d) list the symptoms of diabetes mellitus, that reflect such metabolic changes; c) draw a diagram of one of the mctabolic pathways that is activated in the liver under these conditions and explain the consequences of such activation.arrow_forward
- TPI deficiency is a rare human condition. Patients who lack TPI cannot convert the triose dihydroxyacetone phosphate into glyceraldehyde 3-phosphate.What happens to glycolysis in TPI patients?TPI patients suffer from chronic hemolytic anemia (abnormal breakdown of red blood cells) and have variable neuromuscular dysfunctions, including muscle weakness, poor muscle tone, and atrophy. Most die of respiratory failure during childhood. Explain why TPI-deficient patients exhibit these conditions using the diagram to justify your answer. TPI is enzyme 5.G6PD deficiency is one of the most common human genetic conditions, affecting about 40 million people worldwide. Patients suffer from hemolytic anemia when exposed to certain drugs, viral or bacterial disease, or fava beans.arrow_forwardIf there was India Ink added to a culture of Paramecium caudatum, it would increase the average number of food vacuoles because India ink contains no sugar or nutrients and the formation of food vacuoles would be the first stage in the metabolic process when digesting nutrient-rich particles. What would be the observed effects on the number of food vacuoles of different concentrations such as 1% (v/v), 10% (v/v), and 25% (v/v) of India ink? Will it change over a duration of 30 minutes?arrow_forwardUnder aerobic conditions of high ratios of NADH/NAD+ and ATP/ADP, as pyruvate is utilized for its carbon skeleton, which molecules would you expect to see significant radiolabeling in the liver? Select all that apply. **Please note some molecules contain more details, including not only molecule name, but location of the label. Pick the options that are accurate for the above situation. 1. Glucose C2 & C5 2. Glucose C1 & C6 3. Glucose C2 only 4. Pyruvate C1 5. Lactate C2 for export 6.CO2 from TCA cycle shows some radiolabel 7. Label is halved over many TCA cycles 8. Oxaloacetate 9. Malatearrow_forward
- What is the yield of ATP when each of the following substrates is completely oxidized to CO2 by a mammalian cellhomogenate? Assume that glycolysis, the citric acid cycle and oxidative phosphorylation are fully active. a) fructose-1,6-bisphosphate b) dihydroxyacetone phosphatearrow_forwardIf there was India Ink added to a culture of Paramecium caudatum, it would increase the average number of food vacuoles because India ink contains no sugar or nutrients and the formation of food vacuoles would be the first stage in the metabolic process when digesting nutrient-rich particles. What would be the observed effects on the number of food vacuoles over a duration of 30 minutes for different concentrations such as 1% (v/v), 10% (v/v), and 25% (v/v) of India ink?arrow_forwardWhich of the following is the correct summary of the anaerobic breakdown of glucose in the skeletal muscle? Glucose + ADP + Pi ⟶ lactate + ATP Glucose + 2ADP + 2Pi ⟶ 2 lactate + 2ATP Glucose + 2ADP + 2Pi + 2NAD+ ⟶ 2 pyruvate + 2ATP + 2NADH + 2H+ Glucose + ADP + Pi ⟶ pyruvate + ATP Glucose + 2ADP + 2Pi ⟶ 2 pyruvate + 2ATParrow_forward
 Human Anatomy & Physiology (11th Edition)BiologyISBN:9780134580999Author:Elaine N. Marieb, Katja N. HoehnPublisher:PEARSON
 Biology 2eBiologyISBN:9781947172517Author:Matthew Douglas, Jung Choi, Mary Ann ClarkPublisher:OpenStax
 Anatomy & PhysiologyBiologyISBN:9781259398629Author:McKinley, Michael P., O'loughlin, Valerie Dean, Bidle, Theresa StouterPublisher:Mcgraw Hill Education,
 Molecular Biology of the Cell (Sixth Edition)BiologyISBN:9780815344322Author:Bruce Alberts, Alexander D. Johnson, Julian Lewis, David Morgan, Martin Raff, Keith Roberts, Peter WalterPublisher:W. W. Norton & Company
 Laboratory Manual For Human Anatomy & PhysiologyBiologyISBN:9781260159363Author:Martin, Terry R., Prentice-craver, CynthiaPublisher:McGraw-Hill Publishing Co.
 Inquiry Into Life (16th Edition)BiologyISBN:9781260231700Author:Sylvia S. Mader, Michael WindelspechtPublisher:McGraw Hill Education


