
Numerical Analysis
3rd Edition
ISBN: 9780134696454
Author: Sauer, Tim
Publisher: Pearson,
expand_more
expand_more
format_list_bulleted
Videos
Textbook Question
Chapter 3.1, Problem 1CP
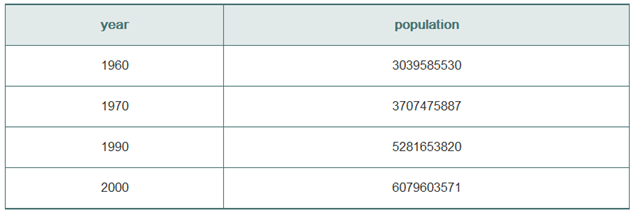
Apply the following world population figures to estimate the 1980 population, using (a) the straight line through the 1970 and 1990 estimates: (b) the parabola through the 1960, 1970, and 1990 estimates: and (c) the cubic curve through all four data points. Compare with the 1980 estimate of 4452584592.
Expert Solution & Answer
Want to see the full answer?
Check out a sample textbook solution
Students have asked these similar questions
Which of the following could most be considered an ordinal variable?
a.
Height (ft)
b.
Weight (kg)
c.
Body mass index (kg/m2)
d.
Education level
e.
Annual Income ($)
To estimate ages of trees, forest rangers use a linear model that relates tree diameter
to age. The model is useful because tree diameter is much easier to measure than tree
age (which requires special tools for extracting a representative cross section of the
tree and counting the rings). Use the data in the table below collected for a certain
variety of oaks to answer the following questions.
Diameter (in.) Age (years)
2.5
15
4.0
24
6.0
32
8.0
56
9.0
49
9.5
76
12.5
90
15.5
89
(a)
State, with a reason, which variable is the response variable.
(b)
Obtain the scatter plot for the data and comment on the relationship between
the variables.
(c)
Determine the Pearson correlation coefficient and comment on the result
obtained.
(d)
Obtain the graph and the equation of the regression line for the data.
(e)
State the slope and give an interpretation of the slope of this regression line.
(f)
Use the equation to estimate the age of an oak whose diameter is 18 in.
(g)
Determine the coefficient of…
Suppose the length of a salamander is directly proportional to the cube root of its body mass
(weight). If a hellbender salamander, a species of aquatic giant salamanders found in eastern North
America, is 20 inches in length and weighs 4.096 pounds, find the predicted length of a hellbender
salamander that weighs 5.832 pounds.
O 22 inches
O 22.5 inches
Answer not listed
O 20.5 inches
O 21 inches
O 21.5 inches
Chapter 3 Solutions
Numerical Analysis
Ch. 3.1 - Use Lagrange interpolation to find a polynomial...Ch. 3.1 - Use Newtons divided differences to find the...Ch. 3.1 - How many degree d polynomials pass through the...Ch. 3.1 - (a) Find a polynomial P(x) of degree 3 or less...Ch. 3.1 - (a) Find a polynomial P(x) of degree 3 or less...Ch. 3.1 - Write down a polynomial of degree exactly 5 that...Ch. 3.1 - Find P(0), where P(x) is the degree 10 polynomial...Ch. 3.1 - Let P(x) be the degree 9 polynomial that takes the...Ch. 3.1 - Give an example of the following, or explain why...Ch. 3.1 - Let P(x) be the degree 5 polynomial that takes the...
Ch. 3.1 - Let P1, P2, P3, and P4 be four different points...Ch. 3.1 - Can a degree 3 polynomial intersect a degree 4...Ch. 3.1 - Let P(x) be the degree 10 polynomial through the...Ch. 3.1 - Write down 4 noncollinear points (1,y1), (2,y2),...Ch. 3.1 - Write down the degree 25 polynomial that passes...Ch. 3.1 - List all degree 42 polynomials that pass through...Ch. 3.1 - The estimated mean atmospheric concentration of...Ch. 3.1 - Prob. 18ECh. 3.1 - Apply the following world population figures to...Ch. 3.1 - Write a version of Program 3.2 that is a MATLAB...Ch. 3.1 - Write a MATLAB function polyinterp.m that takes as...Ch. 3.1 - Remodel the sin1 calculator key in Program 3.3 to...Ch. 3.1 - (a) Use the addition formulas for sin and cos to...Ch. 3.2 - Find the degree 2 interpolating polynomial P2(x)...Ch. 3.2 - (a) Given the data points (1,0), (2,In2), (4,In4),...Ch. 3.2 - Assume that the polynomial P9(x) interpolates the...Ch. 3.2 - Consider the interpolating polynomial for...Ch. 3.2 - Assume that a function f(x) has been approximated...Ch. 3.2 - Assume that the polynomial P5(x) interpolates a...Ch. 3.2 - (a) Use the method of divided differences to find...Ch. 3.2 - Plot the interpolation error of the sin1 key from...Ch. 3.2 - The total world oil production in millions of...Ch. 3.2 - Use the degree 3 polynomial through the first four...Ch. 3.3 - List the Chebyshev interpolation nodes x1,...,xn...Ch. 3.3 - Find the upper bound for | (xx1)...(xxn) | on the...Ch. 3.3 - Assume that Chebyshev interpolation is used to...Ch. 3.3 - Answer the same questions as in Exercise 3, but...Ch. 3.3 - Find an upper bound for the error on [ 0,2 ] when...Ch. 3.3 - Assume that you are to use Chebyshev interpolation...Ch. 3.3 - Suppose you are designing the In key for a...Ch. 3.3 - Let Tn(x) denote the degree n Chebyshev...Ch. 3.3 - Determine the following values: (a) T999(1) (b)...Ch. 3.3 - Prob. 1CPCh. 3.3 - Prob. 2CPCh. 3.3 - Carry out the steps of Computer Problem 2 forIn x,...Ch. 3.3 - Let f(x)=e| x |, Compare evenly spaced...Ch. 3.3 - Prob. 5CPCh. 3.4 - Decide whether the equations form a cubic spline....Ch. 3.4 - Check the spline conditions for {...Ch. 3.4 - Find c in the following cubic splines. Which of...Ch. 3.4 - Find k1,k2,k3 in the following cubic spline. Which...Ch. 3.4 - How many natural cubic splines on [ 0,2 ] are...Ch. 3.4 - Find the parabolically terminated cubic spline...Ch. 3.4 - Solve equations 3.26 to find the natural cubic...Ch. 3.4 - Solve equations 3.26 to find the natural cubic...Ch. 3.4 - Prob. 9ECh. 3.4 - True or false: Given n=3 data points, the...Ch. 3.4 - (a) How many parabolically terminated cubic...Ch. 3.4 - How many not-a-knot cubic splines are there for...Ch. 3.4 - Find b1 and c3 in the cubic spline S(x)={...Ch. 3.4 - Prob. 14ECh. 3.4 - Prob. 15ECh. 3.4 - Prob. 16ECh. 3.4 - Prob. 17ECh. 3.4 - Prob. 18ECh. 3.4 - Prob. 19ECh. 3.4 - Discuss the existence and uniqueness of a...Ch. 3.4 - Prob. 21ECh. 3.4 - Prob. 1CPCh. 3.4 - Find and plot the not-a-knot cubic spline that...Ch. 3.4 - Find and plot the cubic spline S satisfying...Ch. 3.4 - Prob. 4CPCh. 3.4 - Prob. 5CPCh. 3.4 - Find and plot the cubic spline S satisfying...Ch. 3.4 - Prob. 7CPCh. 3.4 - Prob. 8CPCh. 3.4 - Find the clamped cubic spline that interpolates...Ch. 3.4 - Find the number of interpolation nodes in Computer...Ch. 3.4 - (a) Consider the natural cubic spline through the...Ch. 3.4 - Prob. 12CPCh. 3.4 - In a single plot, show the natural, not-a-knot,...Ch. 3.4 - Prob. 14CPCh. 3.4 - Prob. 15CPCh. 3.5 - Find the one-piece BĂ©zier curve (x(t),y(t))...Ch. 3.5 - Find the first endpoint two control points, and...Ch. 3.5 - Find the three-piece BĂ©zier curve forming the...Ch. 3.5 - Build a four-piece BĂ©zier spline that forms a...Ch. 3.5 - Describe the character drawn by the following...Ch. 3.5 - Describe the character drawn by the following...Ch. 3.5 - Find a one-piece BĂ©zier spline that has vertical...Ch. 3.5 - Find a one-piece Bezier spline that has a...Ch. 3.5 - Prob. 9ECh. 3.5 - Find the knots and control points for the...Ch. 3.5 - Prove the facts in (3.27), and explain how they...Ch. 3.5 - Given (x1,y1), (x2,y2), (x3,y3), and (x4,y4), show...Ch. 3.5 - Plot the cure in Exercise 7.Ch. 3.5 - Prob. 2CPCh. 3.5 - Plot the letter from BĂ©zier curves: (a) W (b) B...Ch. 3.5 - Use the bezierdraw.m program of Section 3.5 to...Ch. 3.5 - Revise the draw program to accept an n8 matrix of...Ch. 3.5 - Using the template above and your favorite text...Ch. 3.5 - Prob. 4SACh. 3.5 - Although font information was a closely guarded...Ch. 3.5 - Prob. 6SA
Knowledge Booster


Learn more about
Need a deep-dive on the concept behind this application? Look no further. Learn more about this topic, subject and related others by exploring similar questions and additional content below.Similar questions
- Find the mean hourly cost when the cell phone described above is used for 240 minutes.arrow_forwardAverage adult Americans are about one inch taller, but nearly a whopping 25 pounds heavier than they were in 1960, according to a new report from the Centers for Disease Control and Prevention (CDC). The bad news, says CDC is that average BMI (body mass index, a weight-for-height formula used to measure obesity) has increased among adults...” Boston is considered one of America’s healthiest cities – is the weight gain since 1960 similar in Boston? A sample of n=28 adults suggested a mean increase of 19.5 pounds over the mean recorded in 1960 with a standard deviation of 8.6 pounds. Is Boston statistically significantly different in terms of weight gain from the national mean since 1960? Run the appropriate test at a 5% level of significance. Please use the five steps to demonstrate proper hypothesis testing and explain your results. Please do not use any software calculations.arrow_forwardUse a linear approximation to estimate the following numbers without using a calculator: a. 7.942/3 b. In 1.07arrow_forward
- An alternative to the body mass index (BMI) for estimating the health risks of obesity is A Body Shape Index (ABSI), given by the formula shown below, where w and h are the waist and height, respectively, in meters, and b is the BMI. The national Heart, Lung, and Blood Institute uses the BMI to determine whether a person is "overweight" (25 ≤ BMI <30) or "obese" (BMI ≥ 30). Complete parts (a) through (d). ABSI = W 2 1 32 bh a. Suppose a man is 1.83 m tall with a waist of 0.885 m and a BMI of 22.9. Find the ABSI for such a person. How does this compare with the average ABSI for a 52-year-old man of 0.0831? The ABSI for this person is 0.081, which is (Round to three decimal places as needed.) less than the average ABSI for a 52-year-old man. b. For the person described in part a, find the rate that the ABSI is going up with respect to his waist. To find the rate that the ABSI is going up with respect to his waist, take the partial derivative of ABSI with respect to w. The value of ABSI…arrow_forwardAn alternative to the body mass index (BMI) for estimating the health risks of obesity is A Body Shape Index (ABSI), given by the formula shown below, where w and h are the waist and height, respectively, in meters, and b is the BMI. The national Heart, Lung, and Blood Institute uses the BMI to determine whether a person is "overweight" (25 ≤ BMI <30) or "obese" (BMI ≥ 30). Complete parts (a) through (d). ABSI = W 2 1 3. 2 bh a. Suppose a man is 1.83 m tall with a waist of 0.885 m and a BMI of 22.9. Find the ABSI for such a person. How does this compare with the average ABSI for a 52-year-old man of 0.0831? The ABSI for this person is, which is (Round to three decimal places as neede the average ABSI for a 52-year-old man. less than greater than the same asarrow_forwarda population consisted of 75,000 people, surveying 750 people from the population could result in a parameter but not a point estimate. A. True B. Falsearrow_forward
- What region exported Milk at the lowest price? What is the corresponding price? Express the price in the unit of USD kg-1 and to two decimal places.arrow_forwardThe Department of Agriculture obtained the following data representing the one-week growth in centimeters of 30 newly planted corn plants.arrow_forwardsevere storms indicate that e3.5 feet. Does this information suggest that the storm is (perhaps temporarily) increasing above the severe rating? Use off fxed cement piers. Suppose that a reading of 31 waves showed an average wave height of x= 16.7 feet. Previous studies of Weatherwise is a magazine published by the American Meteorological Society. One issue gives a rating system used to classify Nor'easter storms that frequently hit New England and can cause much damage near the ocean. A severe storm has an average peak wave height of 164 feet for waves hitting the shore. Suppose that a Nor'easter is in progress at the severe storm class rating. Peak wave heights are usually measured from land C (a) What is the level of significance? State the null and alternate hypotheses. Ho: H- 16.4 ft; H:>'16.4 ft Ho: H 16.4 ft; H1: = 16.4 ft Ho: H- 16.4 ft; H: H+ 16.4 ft (b) What sampling distribution will you use? Explain the rationale for your choice of sampling distribution. The standard…arrow_forward
- "compute the indicated quantity."arrow_forward1. 6) You are preparing a computer presentation to be digitally projected onto the wall of your classroom. Your computer screen is 13.25 inches wide and 10.6 inches high. The projected image on the wall is 53 inches wide and 42.4 inches high. Are the two shapes similar? If so, find the scale factor of the computer screen to the projected image.arrow_forwardUse the figure below to estimatearrow_forward
arrow_back_ios
SEE MORE QUESTIONS
arrow_forward_ios
Recommended textbooks for you
 Mathematics For Machine TechnologyAdvanced MathISBN:9781337798310Author:Peterson, John.Publisher:Cengage Learning,
 College Algebra (MindTap Course List)AlgebraISBN:9781305652231Author:R. David Gustafson, Jeff HughesPublisher:Cengage Learning
 Algebra: Structure And Method, Book 1AlgebraISBN:9780395977224Author:Richard G. Brown, Mary P. Dolciani, Robert H. Sorgenfrey, William L. ColePublisher:McDougal Littell
Mathematics For Machine Technology
Advanced Math
ISBN:9781337798310
Author:Peterson, John.
Publisher:Cengage Learning,
College Algebra (MindTap Course List)
Algebra
ISBN:9781305652231
Author:R. David Gustafson, Jeff Hughes
Publisher:Cengage Learning
Algebra: Structure And Method, Book 1
Algebra
ISBN:9780395977224
Author:Richard G. Brown, Mary P. Dolciani, Robert H. Sorgenfrey, William L. Cole
Publisher:McDougal Littell
Hypothesis Testing using Confidence Interval Approach; Author: BUM2413 Applied Statistics UMP;https://www.youtube.com/watch?v=Hq1l3e9pLyY;License: Standard YouTube License, CC-BY
Hypothesis Testing - Difference of Two Means - Student's -Distribution & Normal Distribution; Author: The Organic Chemistry Tutor;https://www.youtube.com/watch?v=UcZwyzwWU7o;License: Standard Youtube License