
Concept explainers
Videos
a.
To explain: Whether pie chart is appropriate for this data.
a.
Answer to Problem 111E
Yes, it is appropriate.
Explanation of Solution
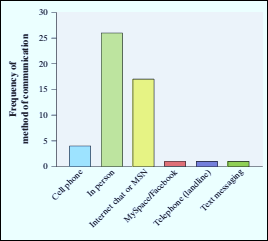
Given:
The figure is:
Calculation:
To construct the pie chart one condition is that individual must belong to only one category. Here, pie chart is appropriate because here one individual belongs to only one category. Thus, pie chart is appropriate in this case.
b.
To identify: The mistake in Jerry’s interpretation.
b.
Explanation of Solution
According to Jerry, the bar graph is skewed the right. His interpretation for the graph is incorrect because bar graph is constructed for the categorical variables and it is not possible for the categorical data to be in any order. Thus, it is not possible to apply the concept of skewness to the categorical data,
Chapter 1 Solutions
The Practice of Statistics for AP - 4th Edition
Additional Math Textbook Solutions
Elementary Statistics
Basic Business Statistics, Student Value Edition (13th Edition)
Essentials of Statistics (6th Edition)
Fundamentals of Statistics (5th Edition)
Introductory Statistics (10th Edition)
Elementary Statistics (13th Edition)


 MATLAB: An Introduction with ApplicationsStatisticsISBN:9781119256830Author:Amos GilatPublisher:John Wiley & Sons Inc
 Probability and Statistics for Engineering and th...StatisticsISBN:9781305251809Author:Jay L. DevorePublisher:Cengage Learning
 Statistics for The Behavioral Sciences (MindTap C...StatisticsISBN:9781305504912Author:Frederick J Gravetter, Larry B. WallnauPublisher:Cengage Learning
 Elementary Statistics: Picturing the World (7th E...StatisticsISBN:9780134683416Author:Ron Larson, Betsy FarberPublisher:PEARSON
 The Basic Practice of StatisticsStatisticsISBN:9781319042578Author:David S. Moore, William I. Notz, Michael A. FlignerPublisher:W. H. Freeman
 Introduction to the Practice of StatisticsStatisticsISBN:9781319013387Author:David S. Moore, George P. McCabe, Bruce A. CraigPublisher:W. H. Freeman