
Videos
Teeth whitening results One scientific “test of whiteness” tested the effect of a self applied tooth-whitening peroxide gel system in a randomized, controlled clinical trial.9 The 58 adults assigned to the gel whitening group applied the gel after normal brushing according to the manufacturer’s instructions. The fluoride toothpaste group was instructed to brush twice a day. The procedure was repeated for both groups twice a day for 14 days. An experienced examiner determined the tooth shades comparing each tooth to the shade tabs from an accepted shade scale (Vita shade guide) at the start of the experiment to create a baseline and then after one and two weeks of product application. Changes between the baseline score and the one-and two-week assessments were expressed as a difference of the respective Vita score, with a positive difference indicating an improvement in tooth whiteness. The results of the study are shown in the following table.
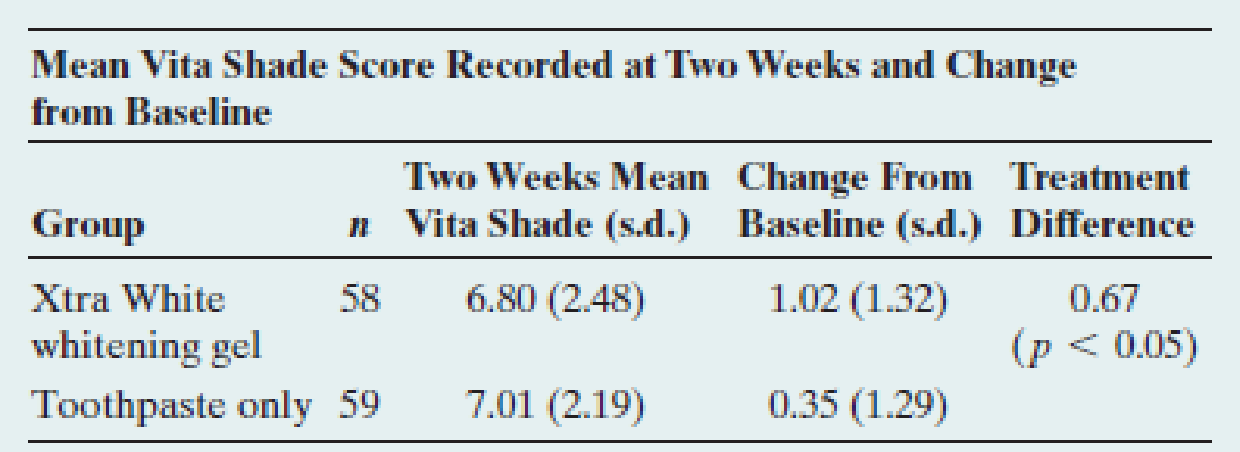
- a. State the hypotheses that were tested for the change from baseline
means . - b. The P-value is reported as <0.05 for the test comparing the means. Explain how to interpret this value.
- c. Calculate the pooled standard error, the t statistic, and the resulting P-value.
- d. The ratio of the change from baseline sample means was 2.91. Interpret this ratio.
Want to see the full answer?
Check out a sample textbook solution
Chapter 10 Solutions
Statistics: The Art and Science of Learning from Data (4th Edition)


- K Contrast bath treatments use the immersion of an injured limb alternately in water of two contrasting temperatures. Those who use the method claim that it can reduce swelling. Researchers compared three treatments: (1) contrast baths and exercise, (2) contrast baths alone, and (3) exercise alone. They report the boxplots to the right, (... Change in Volume (cc) 40- 20- 0- -20- -40- O HH • HTH TH Treatment 3 a) The researchers conclude that the differences were not statistically significant. Explain what that means in context. Q o OA. There is no evidence that the changes in swelling were different among the three treatments. The experiment should be run again with more subjects. OB. There is evidence that the changes in swelling were different among the three treatments, but not enough data to tell which treatment was most effective. All three treatments appear to cause an unknown but unequal reduction in swelling. OC. There is no evidence that the changes in swelling were different…arrow_forwarda study of the effects of color on easing anxiety cpmpared anxiety test scores of prticipants who completed the test printed on either soft yellow paper or on harsh green paper.the scores for the five participants who cpmpleted the test on the green paper were 20, 26, 28, 21, and 18. the scores for four particiopants who completed the test on green paper were 20, 26, 17, and 24. using the .05 level, one-tailed (predicting lower anxiety scores for the yellow paper), what should the researcher colclude? a. use the steps of hypothesis testingarrow_forwardThe research and development (R&D) department of a paint manufacturer recently developed a new paint product. The developers are concerned the average area covered per gallon will be less for the new paint than for the existing product. To investigate this concern, the R&D department set up a test in which two random samples of paint were selected. The first sample consisted of 25 one-gallon containers of the company's existing product, and the second of 15 one-gallon containers of the new paint. The statistics shown were computed from eachsample and refer to the number of square feet that each gallon will cover. Based on the sample data, what should the developers conclude using a significance level of 0.05? Assume the populations are normally distributed with equal variances.Current Paint New Paint Current Paint New Paint x1 = Current Paint Column 423 sq. feet x2 = New Paint Column 418 sq feet s1 = 21.7 s2 =…arrow_forward
- 3. A researcher was interested in the effects of a drug on depression. Subjects were randomly assigned to one of the three groups. Subjects in the control group received a placebo and the subjects in the two treatment groups received either a 0.2 mg or a 0.4 mg dosage of the drug. After several weeks of drug (or placebo) treatment, the researcher measured the subjects' level of depression (a low score indicating greater depression) The following data were obtained. Placebo 0.2 mg 0.4 mg 12 11 12 8 10 9 9 14 11 11 17 13 13 16 15 7 16 12 Mean of X = 10 14 12 S^2 = 5.6 8.4 4 Using 5% of significance, test the hypothesis that the three groups differ in their effectiveness.arrow_forwardA professor of women's studies is interested in determining if stress affects the menstrual cycle. Seventeen women are randomly sampled for an experiment and randomly divided into two groups (n1=9 and n2 = 8). The first of the groups is subjected to high stress for two months while the second lives in a relatively stress-free environment. The professor measures the menstrualarrow_forward1.2 Sinusitis and antibiotics. Researchers studying the effect of antibiotic treatment for acute sinusitis compared to symptomatic treatments randomly assigned 166 adults diagnosed with acute sinusitis to one of two groups: treatment or control. Study participants received either a 10-day course of amoxicillin (an antibiotic) or a placebo similar in appearance and taste. The placebo consisted of symptomatic treatments such as acetaminophen, nasal decongestants, etc. At the end of the 10-day period patients were asked if they experienced significant improvement in symptoms. The distribution of responses is summarized below.52 Group Treatment Control Total Self-reported significant improvement in symptoms No 19 16 35 Yes 66 65 131 Total 85 81 166 (a) What percent of patients in the treatment group experienced a significant improvement in symptoms? What percent in the control group? (b) Based on your findings in part (a), which treatment appears to be more effective for sinusitis? (c) Do…arrow_forward
- In an article about unusual allergies, a doctor explained that allergy to sulfites is usually seen in patients with asthma. The typical reaction is a sudden increase in asthma symptoms after eating a food containing sulfites. Studies are performed to estimate the percentage of the nation's 10 million asthmatics who are allergic to sulfites. In one survey, 32 of 400 randomly selected asthmatics in the country were found to be allergic to sulfites. Find and interpret a 90% confidence interval for the proportion, p, of all asthmatics in the country who are allergic to sulfites. Click here to view page 1 of the table of areas under the standard normal curve. Click here to view page 2 of the table of areas under the standard normal curve. to The 90% confidence interval is from (Round to three decimal places as needed.)arrow_forwardSpecificity of the association is best described as A. when the value of the response variable changes in a meaningful way with the dosage of the suspected cause. B. when the suspected cause precedes the response variable. C. when similar studies produce similar results. D. when all other possible causes are ruled out.arrow_forwardA drug trial had 161 participants. A survey was done to gather information about the participants’ experiences with side effects. The table below gives the results for two possible side effects.arrow_forward
- A clinical trial is run to assess the efficacy of a new drug to reduce high blood pressure. Patients with a diagnosis of hypertension (high blood pressure) are recruited to participate in the trial and randomized to receive either the new drug or placebo. Participants take the assigned drug for 12 weeks and their blood pressure status is recorded. At the end of the trial, participants are classified as still having hypertension or not. The data are shown here:Group Number Randomized Number of Hypertension at 12 WeeksPlacebo 50 18New Drug 50 30 What is the prevalence of hypertension at the end of the trial?A)48%B)18%C)30%D)12%arrow_forwardA clinical trial is run to assess the efficacy of a new drug to reduce high blood pressure. Patients with a diagnosis of hypertension (high blood pressure) are recruited to participate in the trial and randomized to receive either the new drug or placebo. Participants take the assigned drug for 12 weeks and their blood pressure status is recorded. At the end of the trial, participants are classified as still having hypertension or not. The data are shown here:Group Number Randomized Number of Hypertension at 12 WeeksPlacebo 50 18New Drug 50 30arrow_forwardTo illustrate the effects of driving under the influence of alcohol, a police officer brought a DUI simulator to a high school. Student reaction time in an emergency was measured with unimpaired vision and also while wearing special goggles to simulate the effect of alcohol on vision with the following results: Normal: 4.47, 4.24, 4.58, 4.65, 4.31, 4.8, 4.55, 5, 4.79 Impaired: 5.77, 5.67, 5.51, 5.32, 5.83, 5.49, 5.23, 5.61, 5.63 Is there evidence to suggest that there is a difference at alpha = 0.05level of significance.arrow_forward
 MATLAB: An Introduction with ApplicationsStatisticsISBN:9781119256830Author:Amos GilatPublisher:John Wiley & Sons Inc
 Probability and Statistics for Engineering and th...StatisticsISBN:9781305251809Author:Jay L. DevorePublisher:Cengage Learning
 Statistics for The Behavioral Sciences (MindTap C...StatisticsISBN:9781305504912Author:Frederick J Gravetter, Larry B. WallnauPublisher:Cengage Learning
 Elementary Statistics: Picturing the World (7th E...StatisticsISBN:9780134683416Author:Ron Larson, Betsy FarberPublisher:PEARSON
 The Basic Practice of StatisticsStatisticsISBN:9781319042578Author:David S. Moore, William I. Notz, Michael A. FlignerPublisher:W. H. Freeman
 Introduction to the Practice of StatisticsStatisticsISBN:9781319013387Author:David S. Moore, George P. McCabe, Bruce A. CraigPublisher:W. H. Freeman