
Concept explainers
Videos
Anorexia again Refer to Exercise 10.89, comparing
MINITAB output for comparing mean weight changes
Difference = μ(cogchange) − μ(controlchange)
Estimate for difference: 3.46
95% CI for difference:(−0.68, 7.59)
T-Test of difference = 0 (vs ≠):
T-Value = 1.68 P-Value = 0.100 DF = 53
Both use Pooled StDev = 7.6369
- a. Interpret the reported confidence interval.
- b. Interpret the reported P-value.
- c. What would be the P-value for Ha: μ1 > μ2? Interpret it.
- d. What assumptions do these inferences make?
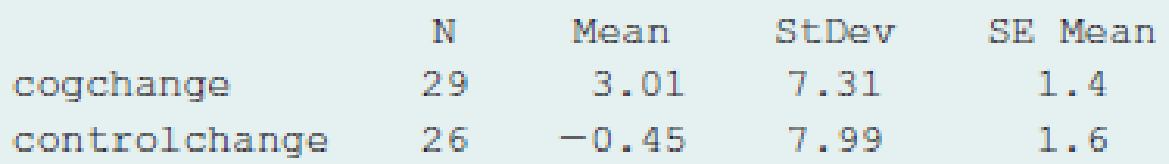
Teenage anorexia Example 8 in Section 9.3 described a study that used a cognitive behavioral therapy to treat a sample of teenage girls who suffered from anorexia. The study observed the mean weight change after a period of treatment. Studies of that type also usually have a control group that receives no treatment or a standard treatment. Then researchers can analyze how the change in weight compares for the treatment group to the control group. In fact, the anorexia study had a control group that received a standard treatment. Teenage girls in the study were randomly assigned to the cognitive behavioral treatment (Group 1) or to the control group (Group 2). The figure shows box plots of the weight changes for the two groups (displayed vertically). The output shows how MINITAB reports inferential comparisons of those two means.
MINITAB Output Comparing Mean Weight Changes
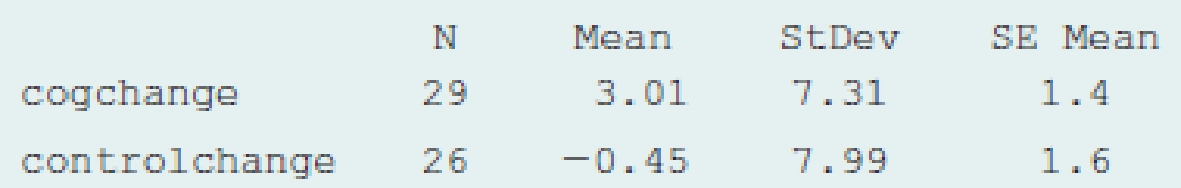
Difference = μ(cogchange) − μ(controlchange)
Estimate for difference: 3.46
95% CI for difference: (−0.71, 7.62)
T-Test of difference = 0 (vs ≠):
T-Value = 1.67 P-Value = 0.102 DF = 50
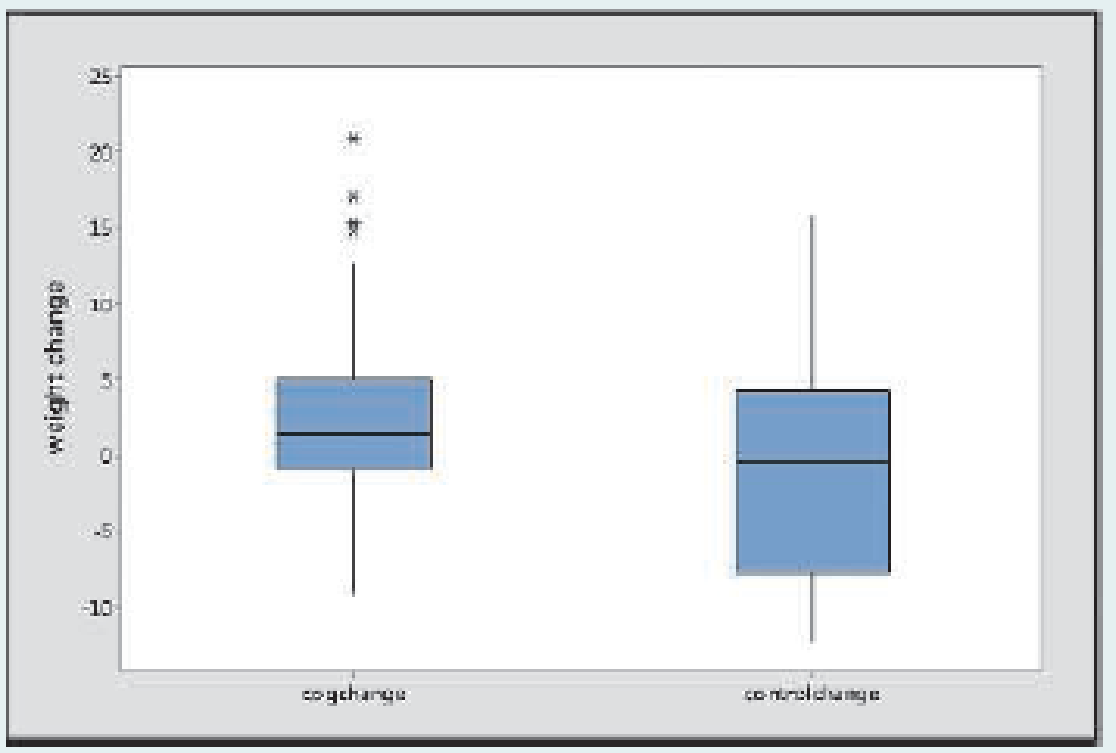
Box plots of weight change for anorexia study.
- a. Report and interpret the P-value for testing H0: μ1 = μ2 against Ha: μ1 ≠∙ μ2.
- b. Summarize the assumptions needed for the analysis in part a. Based on the box plots, would you be nervous if you had to perform a one-sided test instead? Why?
- c. The reported 95% confidence interval tells us that if the population mean weight change is less for the cognitive behavioral group than for the control group, it is just barely less (less than 1 pound), but if the population mean change is greater, it could be nearly 8 pounds greater. Explain how to get this interpretation from the interval reported.
- d. Explain the correspondence between the confidence interval and the decision in the significance test for a 0.05 significance level.
Want to see the full answer?
Check out a sample textbook solution
Chapter 10 Solutions
Statistics: The Art and Science of Learning from Data (4th Edition)


 Glencoe Algebra 1, Student Edition, 9780079039897...AlgebraISBN:9780079039897Author:CarterPublisher:McGraw Hill
 Big Ideas Math A Bridge To Success Algebra 1: Stu...AlgebraISBN:9781680331141Author:HOUGHTON MIFFLIN HARCOURTPublisher:Houghton Mifflin Harcourt