Concept explainers
Videos
The graph below shows the projected growth of the number of Americans aged
a. What is the percent increase in the population of this age group from
b. What is the percent increase in the population of this age group from
c. What is the percent increase in the population of this age group from
d. How many times larger is the population in
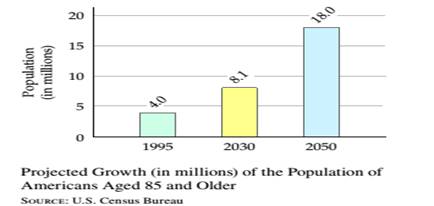
Projected Growth (in millions) of the Population of
Americans Aged
SOURCE: U.S. Census Bureau
Want to see the full answer?
Check out a sample textbook solution
Chapter 9 Solutions
Mathematical Excursions (MindTap Course List)


- In Example 11, during which year did the sales reach $180 billion?arrow_forwardStock Market During the week of June 22, 2009, the closing numbers of the Dow Jones Industrial Average each day were: What was the overall change for the week? Was it positive or negative?arrow_forwardFind the mean hourly cost when the cell phone described above is used for 240 minutes.arrow_forward
 Holt Mcdougal Larson Pre-algebra: Student Edition...AlgebraISBN:9780547587776Author:HOLT MCDOUGALPublisher:HOLT MCDOUGAL
 College Algebra (MindTap Course List)AlgebraISBN:9781305652231Author:R. David Gustafson, Jeff HughesPublisher:Cengage Learning
 College AlgebraAlgebraISBN:9781305115545Author:James Stewart, Lothar Redlin, Saleem WatsonPublisher:Cengage Learning
 Trigonometry (MindTap Course List)TrigonometryISBN:9781337278461Author:Ron LarsonPublisher:Cengage Learning
 Elementary AlgebraAlgebraISBN:9780998625713Author:Lynn Marecek, MaryAnne Anthony-SmithPublisher:OpenStax - Rice University