
Videos
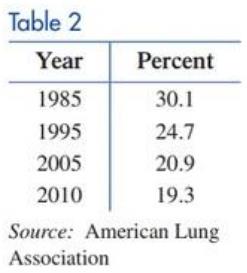
Smoking. Table 2 gives the percentage of U.S. adults who were smokers in the given year.
The following transition matrix
(A) Let
(B) Construct a new table comparing the results from part (A) with the data in Table 2.
(C) According to this transition matrix, what percentage of the adult U.S. population will be smokers in the long run?
Want to see the full answer?
Check out a sample textbook solution
Chapter 9 Solutions
Finite Mathematics for Business, Economics, Life Sciences and Social Sciences
Additional Math Textbook Solutions
Calculus for Business, Economics, Life Sciences, and Social Sciences (13th Edition)
A Problem Solving Approach To Mathematics For Elementary School Teachers (13th Edition)
Mathematics All Around (6th Edition)
Calculus for Business, Economics, Life Sciences, and Social Sciences (14th Edition)
Using & Understanding Mathematics: A Quantitative Reasoning Approach (7th Edition)
Thinking Mathematically (6th Edition)


 Calculus For The Life SciencesCalculusISBN:9780321964038Author:GREENWELL, Raymond N., RITCHEY, Nathan P., Lial, Margaret L.Publisher:Pearson Addison Wesley,
 Big Ideas Math A Bridge To Success Algebra 1: Stu...AlgebraISBN:9781680331141Author:HOUGHTON MIFFLIN HARCOURTPublisher:Houghton Mifflin Harcourt
 Glencoe Algebra 1, Student Edition, 9780079039897...AlgebraISBN:9780079039897Author:CarterPublisher:McGraw Hill