
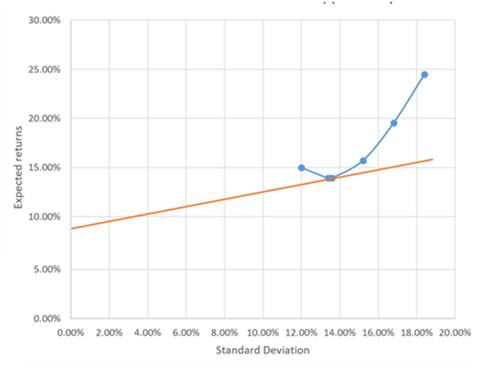
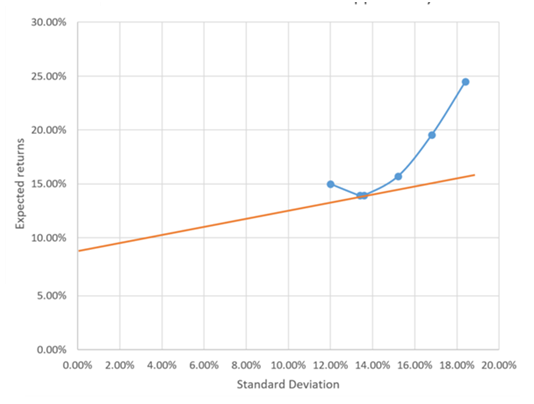
To calculate: The investment opportunity set of the two risky funds is to be tabulated along with the graph.
Introduction: The portfolio risk is defined as the combination of assets which carries its own risk with each investment.
The standard deviation is used to determine that in which manner the values from a data set vary from its mean value. This is calculated by the square root of the variance.
The expected return is defined as the return which is obtained on the risky asset that is expected in future.
Answer to Problem 5PS
Expected return for the portfolio = 13.39%
Standard deviation for the portfolio =
The graph is represented as −
Explanation of Solution
The following formula will be used to calculate the expected return of the portfolio for different proportions of stock and bond-
Where,
The following formula will be used to calculate the standard deviation of the portfolio for different proportions of stock and bond-
The three mutual funds are −
- Stock fund
- Long term government and corporate bond fund
- T-bill money market fund with yield 8%
The probability distribution of the risk fund is given as −
| Expected return | Standard deviation | |
| Stock fund (S) | 20% | 30% |
| Bond fund (B) | 12 | 15 |
The correlation between fund return = 0.10
The minimum variance portfolio is calculated as-
The weight of the stock fund in minimum variance portfolio is calculated as-
For bonds funds:
Put the calculated values in Equ (1) for expected return −
Put the calculated values in Equ (2) for the standard deviation-
The graph between expected return and standard deviation is called as investment opportunity set which is represented as −
Want to see more full solutions like this?
Chapter 7 Solutions
EBK INVESTMENTS

- A pension fund manager is considering three mutual funds. The first is a stock fund, the second is a long-term bond fund, and the third is a money market fund that provides a safe return of 8%. The characteristics of the risky funds are as follows: Expected Return. Stock fund (5) Bond fund (B) The correlation between the fund returns is 0.10. 19% 14 Reg A1 Standard Deviation Required: a-1. What are the investment proportions in the minimum-variance portfolio of the two risky funds? a-2. What are the expected value and standard deviation of the minimum-variance portfolio rate of return? 31% 23 Complete this question by entering your answers in the tabs below. Reg A2 What are the expected value and standard deviation of the minimum-variance portfolio rate of return? Note: Do not round intermediate calculations. Enter your answers as decimals rounded to 4 places.arrow_forwardA pension fund manager is considering three mutual funds. The first is a stock fund, the second is a long-term bond fund, and the third is a money market fund that provides a safe return of 8%. The characteristics of the risky funds are as follows: Stock fund (S) Bond fund (B) Expected Return 17% Standard Deviation 38% 13 18 The correlation between the fund returns is 0.12. Required: a-1. What are the investment proportions in the minimum-variance portfolio of the two risky funds? a-2. What are the expected value and standard deviation of the minimum-variance portfolio rate of return? Complete this question by entering your answers in the tabs below. Req A1 Req A2 What are the expected value and standard deviation of the minimum-variance portfolio rate of return? Note: Do not round intermediate calculations. Enter your answers as decimals rounded to 4 places. Expected return Standard deviationarrow_forwardA pension fund manager is considering three mutual funds. The first is a stock fund, the second is a long-term bond fund, and the third is a money market fund that provides a safe return of 7%. The characteristics of the risky funds are as follows: Stock fund (S) Bond fund (B) The correlation between the fund returns is 0.10. You require that your portfolio yield an expected return of 16%, and that it be efficient, that is, on the steepest feasible CAL. a. What is the standard deviation of your portfolio? (Round your answer to 2 decimal places.) Standard deviation Expected Return Standard Deviation 198 31% 23 14 Money market fund Stocks Bonds 19.33 % b. What is the proportion invested in the money market fund and each of the two risky funds? (Round your answers to 2 decimal places.) Proportion Investedarrow_forward
- A pension fund manager is considering three mutual funds. The first is a stock fund, the second is a long-term bond fund, and the third is a money market fund that provides a safe return of 4%. The characteristics of the risky funds are as follows: Stock fund (S) Exp. Return Bond fund (B) 0.43 15% O 1.00 0.70 11% The correlation between the fund returns is 0.2. Solve numerically for the Sharpe Ratio of the optimal risky portfolio. 0.66 Std. Deviation 0.85 26% 12%arrow_forwardA pension fund manager is considering three mutual funds. The first is a stock fund, the second is a long-term bond fund, and the third is a money market fund that provides a safe return of 8%. The characteristics of the risky funds are as follows: Expected Standard Stock fund (S) Return Deviation 30% 15 20% 12 Bond fund (B) The correlation between the fund returns is 0.10. Solve numerically for the proportions of each asset and for the expected return and standard deviation of the optimal risky portfolio. Note: Do not round intermediate calculations. Enter your answers as decimals rounded to 4 places. Portfolio invested in the stock Portfolio invested in the bond Expected return Standard deviationarrow_forwardYou have just been appointed as a fund manager for Gate Way Fund, of which you will be responsible of a portfolio that consists of two assets. The analysts have provided you with the expected returns and standard deviations of returns of which are listed in the table below: Asset A Asset B Expected Return 7% 11% Standard Deviation 15% 21% Calculate the expected return of the portfolio if half is invested in asset A. If the covariance of the two assets is 28, calculate the correlation coefficient of the portfolio. Calculate the variance of the portfolio if the investments in the two assets classes is equal. Calculate the standard deviation of the portfolio if the assets are equally weighted. The two asset portfolio model can be extended to a portfolio with more assets. Explain the implications of this approach for the understanding of portfolio risk and discuss the practical problems of applying the model in this fashion.arrow_forward
- A fund manager can invest in any combination of the three assets with the following expected returns and standard deviations: Asset 1: r1 = 2%, σ1 = 2% Asset 2: r2 = 6%, σ2 = 6% Asset 3: r3 = 4%, σ3 = 4% All three assets returns are uncorrelated: p12 = p13 =p 23 = 0 . Find a portfolio consisting of these three assets that achieves an expected return of 4% with the lowest risk possible. Show all steps.arrow_forwardA pension fund manager is considering three mutual funds. The first is a stock fund, the second is a long-term government and corporate bond fund, and the third is a T-bill money market fund that yields a rate of 5.9%. The probability distribution of the risky funds is as follows: Stock fund (5) Bond fund (8) Expected Return 20% The correlation between the fund returns is 0.19 Solve numerically for the proportions of each asset and for the expected return and standard deviation of the optimal risky portfolio. (Do not round intermediate calculations and round your final answers to 2 decimal places. Omit the "%" sign in your response.) Portfollo invested in the stock Portfolio invested in the bond Expected retur Standard deviation % Standard Deviation 49% 41 %arrow_forwardA pension fund manager is considering three mutual funds. The first is a stock fund, the second is a long- term bond fund, and the third is a money market fund that provides a safe return of 8%. The characteristics of the risky funds are as follows: Expected Return Standard Deviation Stock fund (5) 19 % 34% Bond fund (8) 10 18 The correlation between the fund returns is 0.11. Solve numerically for the proportions of each asset and for the expected return and standard deviation of the optimal risky portfolio.arrow_forward
- A pension fund manager is considering three mutual funds. The first is a stock fund, the second is a long-term bond fund, and the third is a money market fund that provides a safe return of 7%. The characteristics of the risky funds are as follows: Expected Return Standard Deviation Stock fund (S) 23% 28% Bond fund (B) 15 17 The correlation between the fund returns is 0.12. Solve numerically for the proportions of each asset and for the expected return and standard deviation of the optimal risky portfolio. (Do not round intermediate calculations. Write your answers as decimals rounded to 4 places.)arrow_forwardAs an individual investor, you have three funds to invest into. The first is an equity fund, the second is a corporate bond fund, and the third is a T-bill money-market fund (your risk-free asset). Fund Expected rate of return Risk (Standard deviation) Equity fund 16% 32% Corporate bond fund 12% 18% T-bill money market fund 2% Correlation between equity fund and bond fund returns is 0.4. Find the Expected return of the minimum variance portfolio formed from Equity and Bond fundsarrow_forwardA pension fund manager is considering three mutual funds. The first is a stock fund, the second is a long-term government and corporate bond fund, and the third is a T-bill money market fund that yields a rate of 6%. The probability distribution of the risky funds is as follows: E(r) st. dev. stock fund .24 .33 bond fund .14 .22 The correlation between the fund returns is 0.14. You require that your portfolio yield an expected return of 16%, and that it be efficient, on the best feasible CAL. a. What is the standard deviation of your portfolio? (Round your answer to 2 decimal places.) b. What is the proportion invested in the T-bill fund and each of the two risky funds? (Round your answers to 2 decimal places.)arrow_forward
 Essentials Of InvestmentsFinanceISBN:9781260013924Author:Bodie, Zvi, Kane, Alex, MARCUS, Alan J.Publisher:Mcgraw-hill Education,

 Foundations Of FinanceFinanceISBN:9780134897264Author:KEOWN, Arthur J., Martin, John D., PETTY, J. WilliamPublisher:Pearson,
 Fundamentals of Financial Management (MindTap Cou...FinanceISBN:9781337395250Author:Eugene F. Brigham, Joel F. HoustonPublisher:Cengage Learning
 Corporate Finance (The Mcgraw-hill/Irwin Series i...FinanceISBN:9780077861759Author:Stephen A. Ross Franco Modigliani Professor of Financial Economics Professor, Randolph W Westerfield Robert R. Dockson Deans Chair in Bus. Admin., Jeffrey Jaffe, Bradford D Jordan ProfessorPublisher:McGraw-Hill Education