Concept explainers
Videos
Population Model The following data represent the population of the United States. An ecologist is interested in building a model that describes the population of the United States.
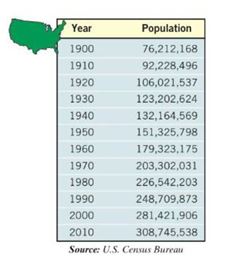
(a) Using a graphing utility, draw a
(b) Using a graphing utility, build a logistic model from the data.
(c) Using a graphing utility, draw the function found in part (b) on the scatter diagram.
(d) Based on the function found in part (b), what is the carrying capacity of the United States?
(e) Use the function found in part (b) to predict the population of the United States in 2012.
(f) When will the United States population be ?
(g) Compare actual U.S. Census figures to the predictions found in parts (e) and (f). Discuss any differences.
Want to see the full answer?
Check out a sample textbook solution
Chapter 5 Solutions
Precalculus Enhanced with Graphing Utilities (7th Edition)


- Does Table 1 represent a linear function? If so, finda linear equation that models the data.arrow_forwardWhat does the y -intercept on the graph of a logistic equation correspond to for a population modeled by that equation?arrow_forwardWhat situations are best modeled by a logistic equation? Give an example, and state a case for why the example is a good fit.arrow_forward
 Calculus For The Life SciencesCalculusISBN:9780321964038Author:GREENWELL, Raymond N., RITCHEY, Nathan P., Lial, Margaret L.Publisher:Pearson Addison Wesley,
 Glencoe Algebra 1, Student Edition, 9780079039897...AlgebraISBN:9780079039897Author:CarterPublisher:McGraw Hill
 Algebra & Trigonometry with Analytic GeometryAlgebraISBN:9781133382119Author:SwokowskiPublisher:Cengage