Videos
Graphical Reasoning Consider the region bounded by the graphs of
(a) Redraw the figure, and complete and shade the rectangles representing the lower sum when
(b) Redraw the figure, and complete and shade the rectangles representing the upper sum when
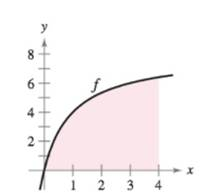
(c) Redraw the figure, and complete and shade the rectangles whose heights are determined by the function values at the midpoint of each subinterval when
(d) Verify the following formulas for approximating the area of the region using n subintervals of equal width.
Lower sum:
Upper sum:
Midpoint Rule:
(e) Use a graphing utility to create a table of values of s(n),S(n), and M(n) for
(f) Explain why s(n) increases and S(n) decreases for increasing values of n, as shown in the table in part (e).
Want to see the full answer?
Check out a sample textbook solution
Chapter 4 Solutions
Calculus of a Single Variable


 Algebra & Trigonometry with Analytic GeometryAlgebraISBN:9781133382119Author:SwokowskiPublisher:Cengage