Concept explainers
Videos
A tension test was performed on a steel specimen having an original diameter of 0.503 in. and gage length of 2.00 in. The data is listed in the table. Plot the stress-strain diagram and determine approximately the modulus of elasticity, the yield stress, the ultimate stress, and the fracture stress. Use a scale of 1 in. = 20 ksi and 1 in. = 0.05 in./in. Redraw the elastic region, using the same stress scale but a strain scale of 1 in. = 0.001 in./in.
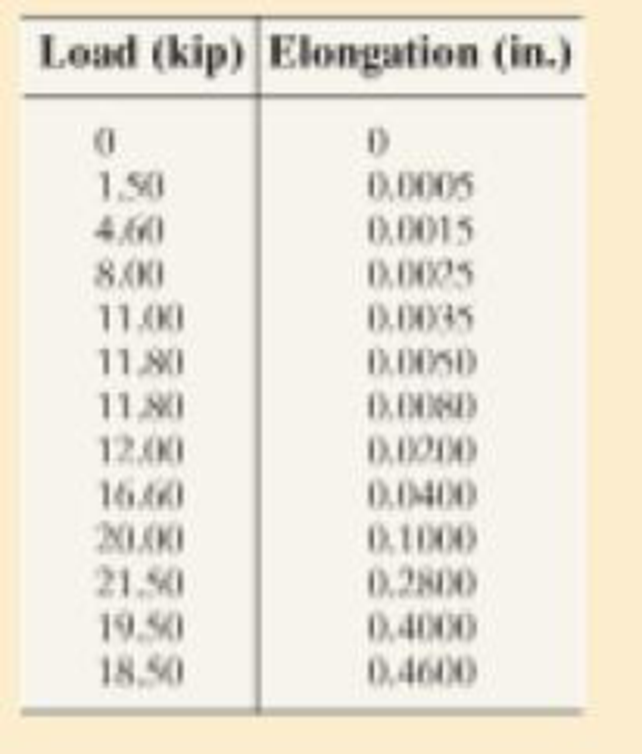
Prob. 3–1
Want to see the full answer?
Check out a sample textbook solution
Chapter 3 Solutions
Mechanics of Materials
Additional Engineering Textbook Solutions
Applied Fluid Mechanics (7th Edition)
Automotive Technology: Principles, Diagnosis, And Service (6th Edition) (halderman Automotive Series)
Statics and Mechanics of Materials (5th Edition)
Engineering Mechanics: Statics & Dynamics (14th Edition)
Automotive Technology: Principles, Diagnosis, and Service (5th Edition)
Engineering Mechanics: Dynamics (14th Edition)


- The principal plane stresses and associated strains in a 35 ksi, 02 = 15 ksi, plane at a point are 01 1 €1 = 1.02(10-3), 2 = 0.180(10-³). ▼ Determine the modulus of elasticity. Express your answer using three significant figures and include the appropriate units. E= Submit Part B V= μA Value Request Answer Submit Determine the Poisson's ratio. Express your answer using three significant figures. ΠΑΠΙ ΑΣΦ | Η VE Units Request Answer ? vec POSSIA space ?arrow_forwardNatural rubber is tested in tension to a maximum extension ratio of λ = 3. The Mooney-Rivlin constants for this material are found to be C1 = 0.069 MPa and C2 = 0.125 MPa. Plot the corresponding uniaxial stress vs. extension ratio behavior over the tested range. Derive an expression for the slope of the function, then determine the secant and tangent moduli at 100% strain.arrow_forwardTensile test specimens are extracted from the "X" and "y" directions of a rolled sheet of metal. "x" is the rolling direction, "y" is transverse to the rolling direction, and "z" is in the thickness direction. Both specimens were pulled to a longitudinal strain = 0.15 strain. For the sample in the x-direction, the width strain was measured to be ew= -0.0923 at that instant. For the sample in the y-direction, the width strain was measured to be gw=-0.1000 at that instant. The yield strength of the x-direction specimen was 50 kpsi and the yield strength of the y-direction specimen was 52 kpsi. Determine the strain ratio for the x direction tensile test specimen. Determine the strain ratio for the y-direction tensile test specimen. Determine the expected yield strength in the z-direction. Give your answer in units of kpsi (just the number). If the sheet is plastically deformed in equal biaxial tension (a, = 0, to the point where & = 0.15, calculate the strain, 6, that would be expected.arrow_forward
- Shown is the stress-strain curve developed from the tension test of a metal alloy bar. The specimen used to develop the stress-strain curve has a round cross-section with a diameter of d = 7 mm and a gauge length of L = 370 mm. Determine the load that must be applied to the specimen to stress the specimen to it's 0.2% offset yield. Express your answer in kN to the nearest whole kN. Your written solution must also include the length of the specimen when stressed to the 0.2% offset yield stress. σ (MPa) 700 600 500 400 300 200 100 0 0.02 0.04 0.06 0.08 0.10 0.002 0.004 0.006 0.008 0.010 € (mm/mm) P darrow_forwardThe elastic portion of the tension stress–strain diagram for an aluminum alloy is shown in the figure. The specimen used for the test has a gage length of 2 in. and a diameter of 0.5 in. If the applied load is 10 kip, determine the new diameter of the specimen. The shear modulus is Gal = 3.811032 ksi.arrow_forwardA tension test was performed on a specimen having an original diameter of 12.5 mm and a gage length of 50mm. The data are listed in the table below: Complete the following: Plot the stress-strain curve. Label the y-axis every 50 MPa, and the x-axis every 0.05 mm/mm. Plot the linear portion of the stress-strain curve (first 5 points). Label the y-axis every 50 MPa, and the x-axis every 0.001 mm/mm. Determine the approximate Modulus of Elasticity Determine the approximate Ultimate Stress Determine the approximate Fracture Stress Determine the approximate Modulus of Resilience Determine the approximate Modulus of Toughness Other Requirements: Provide an example hand-written calculation showing how you calculated one point on the curve. Remember to properly label your plots and provide axis labels with units. Hand sketched plots will not be accepted. Use Excel or similar software.arrow_forward
- 8-2. Data taken from a stress-strain test for a ceramic are given in the table. The curve is linear between the origin and the first point. Plot the diagram, and determine the modulus of elasticity and the modulus of resilience. o (MPa) e (mm/mm) 232.4 318.5 0.0006 0.0010 345.8 0.0014 0.0018 360.5 373.8 0.0022arrow_forwardElectrical strain gauges were applied to a notched specimen to determine the stresses in the notch. The results were ex = 0.0019 and ey = -0.00072. Find ox and ay if the material is carbon steel.arrow_forwardDetermine the elastic modulus and the yield strength for the material having the stress-strain curve shown. Use the 0.2% offset method. 1600 1400 1200 E 1000 800 600 400 200 0.5 1 1.5 2 Strain, percent Elastic modulus: (Express your answer in whole numbers.) E = ksi Yield strength: (Express your answer using three significant figures.) Sy = ksi Stress, psiarrow_forward
- A tensile test specimen has a gage length = 3.0 in and diameter 0.75 in. Yielding occurs at a load of 38,000 lb. The corresponding gage length 3.01 03 in (neglect the 0.2 percent yield point). The maximum load of 54,000 lb is reached at a gage length 3.453 in. Determine the tensile strength (round to the nearest whole Ksi) 38arrow_forwardA tensile test specimen of 1045 hot-rolled steel having a diameter of 0.505 in. and a gage length of 2.00 in. was tested to fracture. Stress and strain data obtained during the test are shown. Determine the modulus of elasticity. Stress (ksi) 240 200 160- 120- 80 40- 0+ 0 0 Upper scale O 79100 ksi E O 94000 ksi O 86700 ksi O 63200 ksi O 51900 ksi Lower scale. 0.025 0.050 0.075 0.100 0.125 0.150 0.175 0.002 0.004 0.006 0.008 0.010 0.012 0.014 Strain (in./in.)arrow_forward1. A bicycle wheel is assembled with each spoke pre-tensioned to a tensile force of 95 lbf. The diameter of each spoke is d = 0.0787 in. After the wheel is assembled, a strain gauge is applied to a representative spoke so that the gauge reads zero strain in the pre-tensioned condition. The figure below shows one cycle of strain readings as the wheel rotates through one revolution in use. Zero degrees corresponds to the spoke being between the hub and the ground (i.e., at the six o'clock position). 50 -50 -100 -150 -200 -250 -300 -150 -100 -50 50 100 150 Spoke position in degrees He, microstrainarrow_forward
 Elements Of ElectromagneticsMechanical EngineeringISBN:9780190698614Author:Sadiku, Matthew N. O.Publisher:Oxford University Press
 Mechanics of Materials (10th Edition)Mechanical EngineeringISBN:9780134319650Author:Russell C. HibbelerPublisher:PEARSON
 Thermodynamics: An Engineering ApproachMechanical EngineeringISBN:9781259822674Author:Yunus A. Cengel Dr., Michael A. BolesPublisher:McGraw-Hill Education
 Control Systems EngineeringMechanical EngineeringISBN:9781118170519Author:Norman S. NisePublisher:WILEY
 Mechanics of Materials (MindTap Course List)Mechanical EngineeringISBN:9781337093347Author:Barry J. Goodno, James M. GerePublisher:Cengage Learning
 Engineering Mechanics: StaticsMechanical EngineeringISBN:9781118807330Author:James L. Meriam, L. G. Kraige, J. N. BoltonPublisher:WILEY