
Essentials of Business Analytics (MindTap Course List)
2nd Edition
ISBN: 9781305627734
Author: Jeffrey D. Camm, James J. Cochran, Michael J. Fry, Jeffrey W. Ohlmann, David R. Anderson
Publisher: Cengage Learning
expand_more
expand_more
format_list_bulleted
Concept explainers
Videos
Textbook Question
Chapter 2, Problem 26P
The economic downturn in 2008–2009 resulted in the loss of jobs and an increase in delinquent loans for housing. In projecting where the real estate market was headed in the coming year, economists studied the relationship between the jobless rate and the percentage of delinquent loans. The expectation was that if the jobless rate continued to increase, there would also be an increase in the percentage of delinquent loans. The following data show the jobless rate and the delinquent loan percentage for 27 major real estate markets.
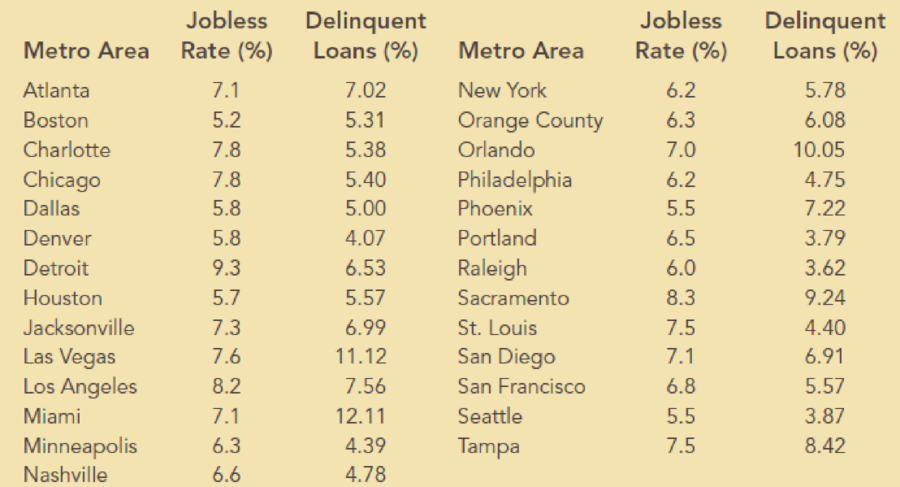
Source: The Wall Street Journal, January 27, 2009.
- a. Compute the
correlation coefficient . Is there apositive correlation between the jobless rate and the percentage of delinquent housing loans? What is your interpretation? - b. Show a
scatter diagram of the relationship between the jobless rate and the percentage of delinquent housing loans.
Expert Solution & Answer
Want to see the full answer?
Check out a sample textbook solution
Students have asked these similar questions
In 2011, home prices and mortgage rates fell so far that in a number of cities the
monthly cost of owning a home was less expensive than renting. The following data
show the average asking rent and the monthly mortgage on the median-priced home
(including taxes and insurance) for 10 cities where the average monthly mortgage
payment was less than the average asking rent (The Wall Street Journal, November
26–27, 2011).
7.
City
Rent ($)
Mortgage ($)
Atlanta
840
539
1062
1002
Chicago
Detroit
823
626
DATA file
Jacksonville, Fla.
Las Vegas
779
711
796
655
RentMortgage
1071
953
Miami
977
Minneapolis
Orlando, Fla.
776
851
695
762
651
654
Phoenix
St. Louis
723
Develop a scatter diagram for these data, treating the average asking rent as the inde-
pendent variable. Does a simple linear regression model appear to be appropriate?
b. Use a simple linear regression model to develop an estimated regression equation to
predict the monthly mortgage on the median-priced home given the average asking…
Suppose the table below gives the average tuition and fees at 2-year and 4-year state schools in a particular state.
Values are adjusted to 2019 dollars.
Academic Year
4-year state school
2-year state school
2005-06
$5,904
$2,661
2006-07
$6,066
$2,539
2007-08
$6,289
$2,604
2008-09
$7,222
$2,901
2009-10
$7,738
$3,065
2010-11
$8,035
$3,117
2011-12
$8,154
$3,108
2012-13
$8,497
$3,075
2013-14
$8,578
$3,025
2014-15
$9,390
$3,326
2015-16
$10,004
$3,504
2016-17
$10,474
$3,663
2017-18
$10,789
$3,830
2018-19
$10,874
$3,859
2019-20
$10,900
$3,907
Here is a graph of the information from the table.
a. What is the absolute change in tuition and fees at this state's four-year institutions from 2005-06 to 2019-20?
b. What is the relative change in tuition and fees at this state's four-year institutions from 2005-06 to 2019-20? Round to the nearest whole percentage…
The recent economic downturn resulted in the loss of jobs and an increase in delinquentloans for housing. In projecting where the real estate market was headed in the comingyear, economists studied the relationship between the jobless rate and the percentage ofdelinquent loans. The expectation was that if the jobless rate continued to increase, therewould also be an increase in the percentage of delinquent loans. The following data showthe jobless rate and the delinquent loan percentage for 27 major real estate markets.
a. Compute the correlation coefficient. Is there a positive correlation between the joblessrate and the percentage of delinquent housing loans? What is your interpretation?b. Show a scatter diagram of the relationship between the jobless rate and the percentage
Chapter 2 Solutions
Essentials of Business Analytics (MindTap Course List)
Ch. 2 - A Wall Street Journal subscriber survey asked 46...Ch. 2 - The following table contains a partial list of...Ch. 2 - Ohio Logistics manages the logistical activities...Ch. 2 - A partial relative frequency distribution is...Ch. 2 - In a recent report, the top five most-visited...Ch. 2 - In a study of how chief executive officers (CEOs)...Ch. 2 - Consumer complaints are frequently reported to the...Ch. 2 - Reports have found that many U.S. adults would...Ch. 2 - Consider the following data: a. Develop a...Ch. 2 - Consider the following frequency distribution....
Ch. 2 - The owner of an automobile repair shop studied the...Ch. 2 - Approximately 1.65 million high school students...Ch. 2 - Consider a sample with data values of 10, 20, 12,...Ch. 2 - Consider a sample with data values of 27, 25, 20,...Ch. 2 - Consider a sample with data values of 53, 55, 70,...Ch. 2 - If an asset declines in value from 5,000 to 3,500...Ch. 2 - Suppose that you initially invested 10,000 in the...Ch. 2 - The average time that Americans commute to work is...Ch. 2 - Suppose that the average waiting time for a...Ch. 2 - According to the National Education Association...Ch. 2 - Return to the waiting times given for the...Ch. 2 - The results of a national survey showed that on...Ch. 2 - Suppose that the national average for the math...Ch. 2 - Five observations taken for two variables follow....Ch. 2 - The scatter chart in the following figure was...Ch. 2 - The economic downturn in 20082009 resulted in the...Ch. 2 - Heavenly Chocolates manufactures and sells quality...
Knowledge Booster


Learn more about
Need a deep-dive on the concept behind this application? Look no further. Learn more about this topic, statistics and related others by exploring similar questions and additional content below.Similar questions
- In 2011 home prices and mortgage rates dropped so low that in a number of cities the monthly cost of owning a home was less expensive than renting. The following data show the average asking rent for 10 markets and the monthly mortgage on the median priced home (including taxes and insurance) for 10 cities where the average monthly mortgage payment was less than the average asking rent (The Wall Street Journal, November 26–27, 2011).Click on the datafile logo to reference the data. Enter negative values as negative numbers. a. Develop the estimated regression equation that can be used to predict the monthly mortgage given the average asking rent (to 2 decimals).The regression equation is:Mortgage ($) = + Rent ($)arrow_forwardAn entrepreneur who owns and operates two businesses (A and B) would like to analyze their profitability. They would like your help in the analysis. They give you the annual net profit (in thousands of $) for each business from 2008-2020. Table 1: Annual Net Profits for Businesses A and B Business Year Profit Business Year Profit 2008 -50 2008 -10 2009 57 2009 30 2010 71 2010 27 2011 64 2011 22 2012 60 2012 21 2013 50 2013 20 A 2014 41 2014 24 2015 59 2015 24 2016 71 2016 32 2017 71 2017 36 2018 74 2018 37 019 81 20 40 2020 97 2020 49 a. Suppose you want to graph the distribution of profits. Explain why using only one stem- plot might not be optimal for the analysis. b. Describe the correct stemplot to use. Generate this stemplot. Explain your steps. What can you say about the distribution from this stemplot? c. When are stemplots useful? And why is that? d. Suppose that instead of having 26 observations you have 200 observations. What graph should you generate? e. What other type of…arrow_forwardThe amount of income spent on housing is an important component of the cost of living. The total costs of housing for homeowners might include mortgage payments, property taxes, and utility costs (water, heat, electricity). An economist selected a sample of 20 homeowners in New England and then calculated these total housing costs as a percent of monthly income, 5 years ago and now. The information is reported below. Is it reasonable to conclude the percent is less now than 5 years ago? Homeowner Five Years Ago Now Homeowner Five Years Ago Now 1 17 % 10 % 11 35 % 32 % 2 20 39 12 16 32 3 29 37 13 23 21 4 43 27 14 33 12 5 36 12 15 44 40 6 43 41 16 44 42 7 45 24 17 28 22 8 19 26 18 29 19 9 49 28 19 39 35 10 49…arrow_forward
- In a two-way data table, you can compare how different values of one input variable influence the return on invested capital by holding the remaining input variables constant. True or False True Falsearrow_forwardConsider the following data on salaries and experience. Persons 2,4,6,8,and 9 have MBA degrees. All others only have undergraduate degrees. a. Calculate the regression of Salary on Experience within a model that controls for whether a person has an MBA or not. b. Print the data set that allows you to do this regression. Sketch the graph the estimated regression that clearly indicates the impact of a MBA degree on Salary. c. What is the market value of the MBA degree? Person Salary Experience 1 $130,468 10 Years 2 $62,250 1 3 $50,000 2.3 4 $140,000 9 5 $110,000 8 6 $80,050 2.8 7 $95,772 7 8 $110,000 6 9 $87,752 4.2 10 $79,290 5arrow_forwarda. Develop a linear-regression-based forecasting model to predict costs. b. Predict costs when patient days are 520, 530, 540, and 550.arrow_forward
- According to a high-profile realtor, houses in the sleepy town of Sun Beach have shown higher appreciation over the past three years than have houses in the bustling town of North Arden. To test the realtor's claim, an economist has found twelve recently sold homes in Sun Beach and twelve recently sold homes in North Arden that were owned for exactly three years. The following table gives the appreciation (expressed as a percentage increase) for each of the twenty- four houses. Appreciation rates in percent Sun Beach 12.5, 12.2, 10.4, 12.9, 6.5, 15.0, 10.1, 10.6, 12.1, 10.8, 10.4, 9.1 North Arden 9.2, 10.7, 9.7, 7.8, 9.7, 12.1, 9.4, 6.1, 7.8, 9.3, 4.6, 11.0 Send data to calculator v Assume that the two populations of appreciation rates are normally distributed and that the population variances are equal. Can we conclude, at the 0.05 level of significance, that houses in Sun Beach have higher appreciation over the past three years than houses in North Arden? Perform a one-tailed test.…arrow_forwardThe ABC Company is involved in the production and selling of consumer goods, particularly beauty products such as bath soap and shampoo and had registered a positive profit growth for the last 10 years. However, the current year seems to be different from those years as the company is expecting a decline in profit; which is estimated to be about 70% below the target. The manager now is in a dilemma … asking himself/herself “What happened, why this decline in profit?” The Manager then asked the company Accountant to give him/her the data on sales and advertising cost for the last 10 years – he/she wants these data to determine whether the company can live without advertising, as advertising cost happens to be substantial. Justify your answer by doing as step-by-step procedure in Correlation Analysis using a 0.05 level of significance. The data are as follows –arrow_forwardThe table to the right represents the annual percentage of smartphones sold in a certain region in 2011, 2012, and 2013 (projected). a. What conclusions can you reach about the market for smartphones in 2011, 2012, and 2013? b. What differences are there in the market for smartphones in 2011, 2012, and 2013? Type Type 1 Type 2 Type 3 Type 4 Type 5 Type 6 2011 2012 52% 65% 18% 16% 1% 6% 13% 7% 13% 3% 4% 2% a. Select all that apply. A. Type 3 had the second largest percentage of smartphones sold in all three years. B. Type 2 had the second largest percentage of smartphones sold in all three years. C. Type 6 had the smallest or close to the smallest percentage of smartphones sold in all three years. D. Type 1 had the largest percentage of smartphones sold in all three years. E. Type 5 had the smallest or close to the smallest percentage of smartphones sold in all three years. 2013 54% 20% 18% 4% 2% 2%arrow_forward
- The Pennsylvania State University had enrollments of 40,571 students in 2000 and 41,289 students in 2004 at its main campus in University Park, Pennsylvania. Assuming the enrollment growth is linear, predict the enrollments in 2008 and 2010.arrow_forwardAccording to a high-profile realtor, houses in the sleepy town of Sun Beach have shown higher appreciation over the past three years than have houses in the bustling town of North Arden. To test the realtor's claim, an economist has found fourteen recently sold homes in Sun Beach and fourteen recently sold homes in North Arden that were owned for exactly three years. The following table gives the appreciation (expressed as a percentage increase) for each of the twenty- eight houses. Appreciation rates in percent Sun Beach 10.4, 8.0, 8.0, 151, 9.9, 11.8, 14.0, 8.9, 9.6, 12.6, 13.8, 10.8, 9.3, 11.1 North Arden 13.5, 9.6, 7.2, 11.1, 5.3, 11.2, 7.1, 10.3, 6.7, 10.9, 6.6, 9.4, 8.2, 5.5 Send data to calculator 144Hz Assume that the two populations of appreciation rates are normally distributed and that the population variances are equal. Can we conclude, at the 0.05 level of significance, that μ₁, the mean appreciation rate of houses in Sun Beach, is higher than μ2, the mean appreciation…arrow_forwardThe National Entrepreneurship and Innovation Programme has initiated a business incubation venture ahead of schedule in the venture lifecycle. Something that must be done is to do a justification for the project. Since very little information is known about the project, the estimates are considered to be rough estimates. The accompanying table is the project manager’s gauge of the income that will occur throughout the following five years: End of Year Cash Flow In (GHC) Cash Flow Out (GHC) 1 0 500,000.00 2 300,000.00 90,000.00 3 400,000.00 100,000.00 4 100,000.00 175,000.00 5 50,000.00 35,000.00 What is the payback period for the project. show workings If the net present value (NPV) for each of the cash flows were calculated at a 10% interest rate, what would the NPV cash flow be at the end of five years? Comment on the feasibility of the project.arrow_forward
arrow_back_ios
SEE MORE QUESTIONS
arrow_forward_ios
Recommended textbooks for you
 Calculus For The Life SciencesCalculusISBN:9780321964038Author:GREENWELL, Raymond N., RITCHEY, Nathan P., Lial, Margaret L.Publisher:Pearson Addison Wesley,
Calculus For The Life Sciences
Calculus
ISBN:9780321964038
Author:GREENWELL, Raymond N., RITCHEY, Nathan P., Lial, Margaret L.
Publisher:Pearson Addison Wesley,
Correlation Vs Regression: Difference Between them with definition & Comparison Chart; Author: Key Differences;https://www.youtube.com/watch?v=Ou2QGSJVd0U;License: Standard YouTube License, CC-BY
Correlation and Regression: Concepts with Illustrative examples; Author: LEARN & APPLY : Lean and Six Sigma;https://www.youtube.com/watch?v=xTpHD5WLuoA;License: Standard YouTube License, CC-BY