
Videos
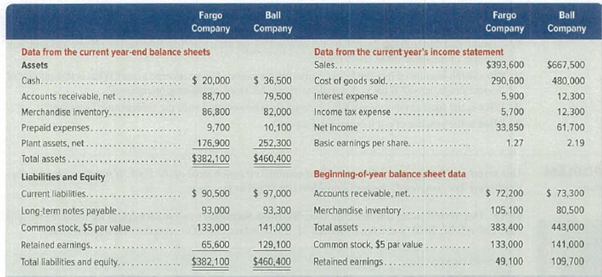
Summary information from the financial statements of two companies competing in the same industry follows.
Required
- 1. For both companies compute the (a)
current ratio , (b) acid-test ratio, (c) accounts receivable turnover, (d) inventory turnover, (e) days’ sales in inventory, and (f) days’ sales uncollected. Round to one decimal place. Identify the company you consider to be the better short-term credit risk and explain why. - 2. For both companies compute the (a) profit margin ratio, (b) total asset turnover, (c) return on total assets, and (d) return on common stockholders’ equity. Assuming that each company paid cash dividends of $1.50 per share and each company’s stock can be purchased at $25 per share, compute their (e) price-earnings ratios and (f) dividend yields. Round to one decimal place; for part b, round to two decimals. Identify which company’s stock you would recommend as the better investment and explain why.
1(a)
Compute the current ratio of Company F and Company B.
Explanation of Solution
Current ratio: Current ratio is one of the liquidity ratios, which measures the capacity of the company to meet its short-term obligations using its current assets. Current ratio is calculated by using the formula:
Compute the current ratio of Company F and Company B:
| Ratios | Company F | Company B |
| Cash | $20,000 | $36,500 |
| Accounts receivables, net | $88,700 | $79,500 |
| Merchandise inventory | $86,800 | $82,000 |
| Prepaid expenses | $9,700 | $10,100 |
| Current assets (A) | $205,200 | $208,100 |
| Current liabilities (B) | $90,500 | $97,000 |
| Current ratio | 2.3:1 | 2.1:1 |
Table (1)
Therefore, the current ratio of Company F and Company B is 2.3 to 1 and 2.1 to 1 respectively.
1(b)
Compute the Acid-test ratio ratio of Company F and Company B.
Explanation of Solution
Acid-test ratio: It is a ratio used to determine a company’s ability to pay back its current liabilities by liquid assets that are current assets except inventory and prepaid expenses.
Compute the Acid-test ratio of Company F and Company B:
| Particulars | Company F | Company B |
| Cash | $20,000 | $36,500 |
| Accounts receivables, net | $77,100 | $70,500 |
| Current notes receivable (trade) | $11,600 | $9,000 |
| Quick assets (C) | $108,700 | $116,000 |
| Current liabilities (D) | $90,500 | $97,000 |
| Acid-test ratio | 1.2:1 | 1.2:1 |
Table (2)
Therefore, the Acid-test ratio of Company F and Company B is 1.2 to 1 and 1.2 to 1 respectively.
1(c)
Compute the accounts receivable turnover ratio of Company F and Company B.
Explanation of Solution
Accounts receivables turnover ratio: Receivables turnover ratio is mainly used to evaluate the collection process efficiency. It helps the company to know the number of times the accounts receivable is collected in a particular time period. This ratio is determined by dividing credit sales and average net receivables.
Compute the accounts receivable turnover ratio of Company F and Company B:
| Particulars | Company F | Company B |
| Beginning Accounts receivables, net (E) | $72,200 | $73,300 |
| Ending Accounts receivables, net (F) | $88,700 | $79,500 |
| Average accounts receivables | $80,450 | $76,400 |
| Net credit sales (H) | $393,600 | $667,500 |
| Accounts receivable turnover ratio | 4.9 times | 8.7 times |
Table (3)
Therefore, the accounts receivable turnover ratio of Company F and Company B is 4.9 to 1 and 8.7 to 1 respectively.
1(d)
Compute the Inventory turnover ratio of Company F and Company B.
Explanation of Solution
Inventory Turnover Ratio: This ratio is a financial metric used by a company to quantify the number of times inventory is used or sold during the accounting period. It is calculated by using the formula:
Compute the Inventory turnover ratio of Company F and Company B:
| Particulars | Company F | Company B |
| Ending inventory (I) | $86,800 | $82,000 |
| Beginning inventory (J) | $105,100 | $80,500 |
| Average inventory (K) | $95,950 | $81,250 |
| Cost of goods sold (L) | $290,600 | $480,000 |
| Inventory turnover ratio | 3.0 times | 5.9 times |
Table (4)
Therefore, the Inventory turnover ratio of Company F and Company B is 3.0 to 1 and 5.9 to 1 respectively.
1(e)
Compute the days’ sales in inventory of Company F and Company B.
Explanation of Solution
Days’ sales in inventory: Days’ in inventory is determined as the number of days a particular company takes to make sales of the inventory available with them.
Compute the days’ sales in inventory of Company F and Company B:
| Particulars | Company F | Company B |
| Ending inventory (M) | $86,800 | $82,000 |
| Cost of goods sold (N) | $290,600 | $480,000 |
| Days’ sales in inventory | 109.0 days | 62.4 days |
Table (5)
Therefore, the days’ sales in Inventory of Company F and Company B are 109 days and 62.4 days respectively.
1(f)
Compute the days’ sales uncollected of Company F and Company B.
Explanation of Solution
Days’ sales uncollected: This ratio is used to determine the number of days a particular company takes to collect accounts receivables.
Compute the days’ sales uncollected of Company F and Company B:
| Particulars | Company F | Company B |
| Ending Accounts receivables, net (F) | $88,700 | $79,500 |
| Net credit sales (O) | $393,600 | $667,500 |
| Days’ sales uncollected | 82.3 days | 43.5 days |
Table (6)
Therefore, the days’ sales uncollected of Company F and Company B are 82.3 days and 43.5 days respectively.
Identify the company with better short-term credit risk and explain the same.
Explanation of Solution
The current ratio of Company F is slightly better than the current ratio of Company B. The acid-test ratios of both the companies are same. The accounts turnover and the inventory turnover of Company B are better than the ratios of Company F. Hence, Company B is better in managing the short term credit risk.
2(a)
Compute the profit margin ratio of Company F and Company B.
Explanation of Solution
Profit margin: It is one of the profitability ratios. Profit margin ratio is used to measure the percentage of net income that is being generated per dollar of revenue or sales.
Given, net income and net sales of Company F are $33,850 and $393,600.
Compute the profit margin ratio of Company F:
Given, net income and net sales of Company B are $61,700 and $667,500.
Compute the profit margin ratio of Company B:
Therefore, the profit margin of Company F and Company B is 8.6% and 9.2% respectively.
2(b)
Compute the total asset turnover of Company F and Company B.
Explanation of Solution
Total asset turnover: Total asset turnover is a ratio that measures the productive capacity of the total assets to generate the sales revenue for the company. Thus, it shows the relationship between the net sales and the average total assets. Turnover of assets is calculated as follows:
Given, average total assets and net sales of Company F are $382,750 (1) and $393,600.
Compute the total assets turnover ratio of Company F:
Given, average total assets and net sales of Company B are $451,700 (1) and $667,500.
Compute the total assets turnover ratio of Company B:
Working note:
Compute the average total assets of Company F and Company B:
| Ratios and Formula | Company F | Company B |
|
Average total assets: |
…… (1)
Table (7)
Therefore, the total assets turnover of Company F and Company B is 1.03 times and 1.48 times respectively.
2(c)
Compute the return on total assets of Company F and Company B.
Explanation of Solution
Return on total assets: Return on total assets is the financial ratio that determines the amount of net income earned by the business with the use of total assets owned by it. It indicates the magnitude of the company’s earnings with relative to its total assets. Return on investment is calculated as follows:
Given, average total assets and net income of Company F are $382,750 (1) and $33,850.
Compute the return on total assets ratio of Company F:
Given, average total assets and net income of Company B are $451,700 (1) and $61,700.
Compute the return on total assets ratio of Company B:
Therefore, the total assets turnover of Company F and Company B is 8.8% and 13.7% respectively.
2(d)
Compute the return on common stockholders’ equity of Company F and Company B.
Explanation of Solution
Return on common stockholders’ equity ratio: It is a profitability ratio that measures the profit generating ability of the company from the invested money of the shareholders. The formula to calculate the return on equity is as follows:
Given, average Common stockholders’ equity and net income of Company F are $190,350 (2) and $33,850.
Compute the return on common stockholders’ equity of Company F:
Given, average Common stockholders’ equity and net income of Company B are $260,400 (2) and $61,700.
Compute the return on common stockholders’ equity of Company B:
Working note:
Compute the average Common stockholders’ equity of Company F and Company B:
| Ratios and Formula | Company F | Company B |
|
Average common stockholders’ equity: |
…… (2)
Table (8)
Therefore, the common stockholders’ equity of Company F and Company B is 17.8% and 23.7% respectively.
2(e)
Compute the price/earnings ratio of Company F and Company B.
Explanation of Solution
Price/Earnings Ratio: The price/earnings ratio shows the market value of the amount invested to earn $1 by a company. It is major tool used by investors for making decisions related to the investment in a company.
Given, market price per share of company F is $25 and earnings per share is $1.27.
Compute the price/earnings ratio of Company F:
Given, market price per share of company B is $25 and earnings per share is $2.19.
Compute the price/earnings ratio of Company B:
Therefore, the price/earnings ratio of Company F and Company B is 19.7 and 11.4 respectively.
2(f)
Compute the dividend yield ratio of Company F and Company B.
Explanation of Solution
Dividend yields: Dividend yield ratio indicates how much percentage of share prices a company pays out in the form of dividends price. The formula to calculate the dividend yield percentage is as follows:
Given, market price per share of company B is $25 and annual dividend per share is $1.50.
Compute the dividend yield ratio of Company F:
Given, market price per share of company B is $25 and annual dividend per share is $1.50.
Compute the dividend yield ratio of Company B:
Therefore, the dividend yield ratio of Company F and Company B is 6.0% and 6.0% respectively.
Identify the company, that its stock would be recommended as the better investment and explain the same.
Explanation of Solution
The price earnings ratio of Company F is slightly better than the price earnings ratio of Company B. The dividend yield ratios of both the companies are same. The profitability ratios of Company B are better than the ratios of Company F. Hence, Hence, Company B is a better investment option.
Want to see more full solutions like this?
Chapter 17 Solutions
Principles of Financial Accounting.


- 10. Review the select information for Bean Superstore and Legumes Plus (industry competitors), and then complete the following. A. Compute the accounts receivable turnover ratios for each company for 2018 and 2019. B. Compute the number of days' sales in receivables ratios for each company for 2018 and 2019. C. Determine which company is the better investment and why. Round answers to two decimal places. BEAN SUPERSTORE LEGUMES PLUS Comparative Balance Sheet December 31, 2017, 2018, and 2019 Comparative Balance Sheet December 31, 2017, 2018, and 2019 2019 2018 2017 2019 2018 2017 Assets Cash $345,600 67,000 145,830 100,465 $330,460 62,000 178,011 101,202 $300,000 59,000 155,205 103,085 $407,000 85,430 128,080 182,006 $386,450 82,670 40,036 23,400 $356,367 79,230 52,142 111,701 Accounts Receivable Inventory Equipment Total Assets $658,895 $671,673 $617,290 $802,516 $532,556 $599,440 Liabilities Salaries Payable Accounts Payable Notes Payable $ 91,455 $ 90,200 70,000 41,000 $ 88,563…arrow_forwarda) Calculate the following ratios i)Gross profit ii)Net profit before taxi iii)Current ratio iv)Accounts receivable turnover in days v)Inventory turnover in days vi)Accounts payable turnover vii)Times interest covered viii)Debt/equity. b)Comment on the profitability and stability of the company using the ratios calculated in (a)(plus any others you think may be relevant) and make recommendations to your friend.arrow_forwardSelect the Income Statements and Balance Sheets of Aramco Saudi from the calculate the following financial ratios: a. Long-term debt ratios b. Total debt ratio c. Times interest earned d. Cash coverage ration e. current ratio f. Quick ratio g. Operating profit margin h. Inventory Turnover i. Days in inventory j. Average collection period k. Return on equity I. Return on assets m. Payout rationsarrow_forward
- Assess the company’s level of liquidity and comment on its ability to meet its short-termfinancial obligations using the following ratios :a. Current Ratiob. Acid-Test or Quick Ratioc. Average collection periodd. Accounts Receivable Turnover ratioe. Inventory Turnover Ratioarrow_forwardCompute the following ratios for the most recent two years, show all values in the computations: 1.Current ratio 2.Accounts receivable turnover 3.Debt ratio(TotalLiabilities/Total Assets, as a percentage) 4.Debt-to-equity ratio Based on the results above, what conclusions can you make about the liquidity and solvency of the company?arrow_forwarda)Please calculate the all ratios of companies - Profitability ratios(Profit margin, Return on assets ,Return on equity) Asset utilization ratios (Receivables turnover, Average collection period, Inventory turnover, Fixed asset turnover, Total asset turnover) Liquidity ratios (Current ratio, Quick ratio) & Debt utilization ratios (Debt total assets, Times interest earned, Fixed charge coverage) b) Calculate all your ratios in and Excel File. You need to show all your calculations in excel file but use the calculated value in your main report. [Note:The answer should be based on "Canadian national railway annual report 2016 and 2017"]arrow_forward
- Solve and perform the different financial ratios using the financial statements of XYZ Company for the year 2021. 1. Current Ratio 2. Quick Ratio 3. Receivables Turnover 4. Inventory Turnover 5. Debt Ratio 6. Equity Ratio 7. Times Interest Earned 8. Gross Profit Margin 9. Operating Profit Margin 10. Net Profit Marginarrow_forwardIdentify which of the following six metrics a through f best completes questions 1 through 3 below. a. Days’ sales uncollected d. Return on total assets b. Accounts receivable turnover e. Total asset turnover c. Working capital f. Profit margin 1. Which two ratios are key components in measuring a company’s operating efficiency? Which ratio summarizes these two components? 2. What measure reflects the difference between current assets and current liabilities? 3. Which two short-term liquidity ratios measure how frequently a company collects its accounts?arrow_forwardBelow are the two basic financial statements of Chiz Trading Company. You are tasked to prepare an analysis using Horizontal and Vertical Analysis of their two-dated financial statements. In addition to this you have been tasked to prepare financial ratios measuring the company’s: Liquidity Status Current Ratios Quick Asset Ratios Efficiency Status Asset Turnover Fixed Asset Turnover Inventory Turnover Days in Inventory Accounts Receivable Turnover Days in Receivable Profitability Status: Gross Profit margin Ratio Operating Income Ratio Net Profit Ratio Return on Assets Return on Equityarrow_forward
- From the given Statement of Financial Position and Income statement, solve for the following: 1) Compute the FINANCIAL ratios that measure: c) Operating Activity -Accounts Receivable Turnover -Days Sales in Receivable -Inventory Turnover -Days in Inventory d) Profitability -Earnings per Share -Return on Asset -Return on Equity -Operating Profit Margin -Net Profit Margin 2) Analyze, interpret, and draw conclusions based on the results of your computations.arrow_forwardWhat information can best be elicited from a receivable ratio? A. company performance with current debt collection B. credit extension effect on cash sales C. likelihood of future customer bankruptcy filings D. an increase in future credit sales to current customersarrow_forwardUsing the following select financial statement information from Black Water Industries, compute the accounts receivable turnover ratios for 2018 and 2019 (round answers to two decimal places). What do the outcomes tell a potential investor about Black Water Industries?arrow_forward
 Financial Accounting: The Impact on Decision Make...AccountingISBN:9781305654174Author:Gary A. Porter, Curtis L. NortonPublisher:Cengage Learning
 Principles of Accounting Volume 1AccountingISBN:9781947172685Author:OpenStaxPublisher:OpenStax College
 Financial AccountingAccountingISBN:9781337272124Author:Carl Warren, James M. Reeve, Jonathan DuchacPublisher:Cengage Learning
 Cornerstones of Financial AccountingAccountingISBN:9781337690881Author:Jay Rich, Jeff JonesPublisher:Cengage Learning