
Concept explainers
Videos
Recompute the regression fits from Probs. (a) 17.3 and (b) 17.17, using the matrix approach. Estimate the standard errors and develop 90% confidence intervals for the coefficients.
(a)
To calculate: The coefficient of the regression fit equation of the given databy the use of matrix approach and then calculate standard error and
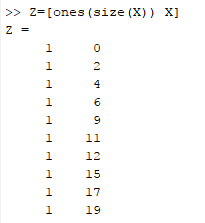
| x | 0 | 2 | 4 | 6 | 9 | 11 | 12 | 15 | 17 | 19 |
| y | 5 | 6 | 7 | 6 | 9 | 8 | 7 | 10 | 12 | 12 |
Answer to Problem 22P
Solution:
The value of coefficient by the use of matrix approach is
Explanation of Solution
Given Information:
The data is,
| x | 0 | 2 | 4 | 6 | 9 | 11 | 12 | 15 | 17 | 19 |
| y | 5 | 6 | 7 | 6 | 9 | 8 | 7 | 10 | 12 | 12 |
Calculation:
The coefficient of the regression fit equation can be found out by the Matrix approach by following the below steps,
Step 1. First make Z matrix that contain column of ones in the first column and in the second column x value is shown.
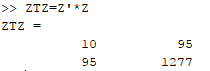
Step 2. Now the coefficient of normal equation is made.
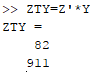
Step 3. Now compute the normal equation of the right hand side that is y data.
Step 4. The coefficient of the model can be found out by taking inverse of the result obtained in step 2 and step 3.
The following MATLAB will perform the desired steps,
On the command window, write this command as,
Now, the coefficient of normal equation is calculated as,
Now, the normal equation of y is calculated as,
Finally, the coefficient of the model can be found out,
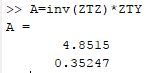
Therefore, the value of coefficientis
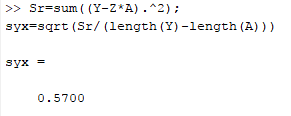
Now, for calculating the standard error follow these commands,
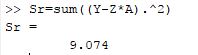
Now calculate
The standard error of the given data is
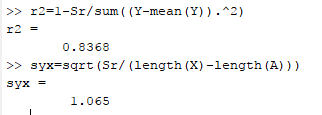
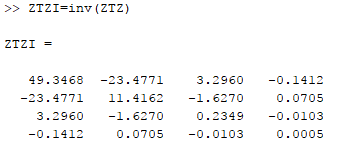
Now for calculating
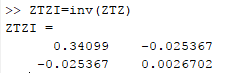
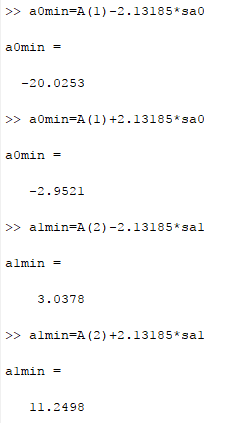
Then the standard error of each coefficient,
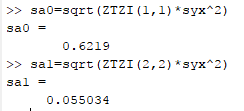
Thevalue of
Hence, the
(b)
To calculate: The coefficient of the regression fit cubic equation of the given databy the use of matrix approach and then calculate standard error and
| x | 3 | 4 | 5 | 7 | 8 | 9 | 11 | 12 |
| y | 1.6 | 3.6 | 4.4 | 3.4 | 2.2 | 2.8 | 3.8 | 4.6 |
Answer to Problem 22P
Solution:
The value of coefficient by the use of matrix approach is
Explanation of Solution
Given Information:
The data is,
| x | 3 | 4 | 5 | 7 | 8 | 9 | 11 | 12 |
| y | 1.6 | 3.6 | 4.4 | 3.4 | 2.2 | 2.8 | 3.8 | 4.6 |
Calculation:
The coefficient of the regression fit equation can be found out by the Matrix approach by following the below steps,
Step 1. First make Z matrix that contain column of ones in the first column and in the second column x value is shown.
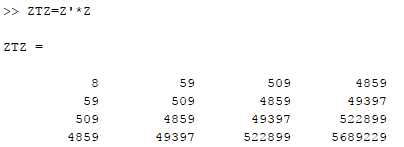
Step 2. Now the coefficient of normal equation is made.
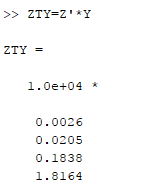
Step 3. Now compute the normal equation of the right hand side that is y data.
Step 4. The coefficient of the model can be found out by taking inverse of the result obtained in step 2 and step 3.
The following MATLAB will perform the desired steps,
On the command window, write this commandfor cubic equation as,
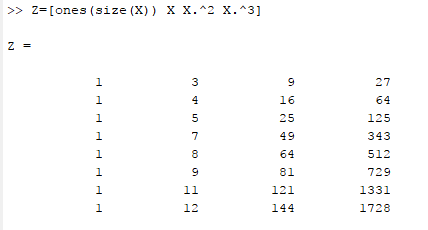
Now, the coefficient of normal equation is calculated as,
Now, the normal equation of y is calculated as,
Finally, the coefficient of the model can be found out,
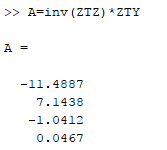
Therefore, the value of coefficient is
Now, for calculating the standard error follow these commands,
The standard error of the given data is
Now for calculating
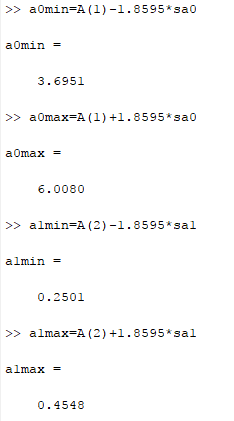
Then the standard error of each coefficient,
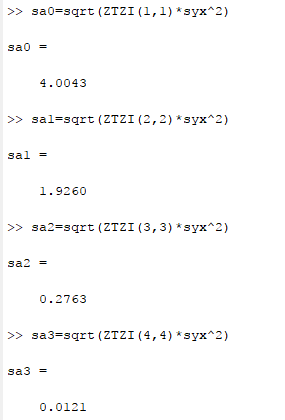
The value of
And,
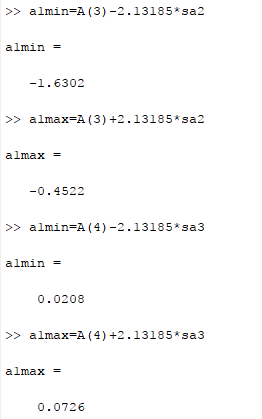
Hence, the
Want to see more full solutions like this?
Chapter 17 Solutions
Numerical Methods For Engineers, 7 Ed


- Olympic Pole Vault The graph in Figure 7 indicates that in recent years the winning Olympic men’s pole vault height has fallen below the value predicted by the regression line in Example 2. This might have occurred because when the pole vault was a new event there was much room for improvement in vaulters’ performances, whereas now even the best training can produce only incremental advances. Let’s see whether concentrating on more recent results gives a better predictor of future records. (a) Use the data in Table 2 (page 176) to complete the table of winning pole vault heights shown in the margin. (Note that we are using x=0 to correspond to the year 1972, where this restricted data set begins.) (b) Find the regression line for the data in part ‚(a). (c) Plot the data and the regression line on the same axes. Does the regression line seem to provide a good model for the data? (d) What does the regression line predict as the winning pole vault height for the 2012 Olympics? Compare this predicted value to the actual 2012 winning height of 5.97 m, as described on page 177. Has this new regression line provided a better prediction than the line in Example 2?arrow_forwardFind the fitted regression line for these data.arrow_forwardFor the regression model Yi = b0 + eI, derive the least squares estimator.arrow_forward
- Find the equation of the regression line for the data based on time spend forstudying and current CGPAarrow_forwardFind the least square regression line for the data points : (1,1), (2,3). (4,5).arrow_forwardA least squares regression line was calculated to relate the length (cm) of newborn boys to their weight in kg. The line is weight = -5.39+0.1621 length. A newborn was 48 cm long and weighed 3 kg. According to the regression model, what was his residual? What does that say about him?arrow_forward
- the least squares regression line for predicting the temperature from the chirp rate is y=32.298+12.297x. If the two chirp rates differ by 1.5 chirps per second, by how much would the temperature differ?arrow_forwardFind the least squares regression line and calculate S, the sum of the squared errors. Use the regression capabilities of a graphing utility to verify your results.arrow_forwardState the four conditions required for making regression inferences.arrow_forward
- A least squares regression line was calculated to relate the length (cm) of newborn boys to their weight in kg. The line is weight = -5.69 + 0.1656 length. A newborn was 48cm long and weighed 33kg. According to the regression model, what was his residual? What does that say about him?arrow_forwardThe regression line ?̂?=4+1.6?? has been fitted to the data points (x, y): (3, 8), (2, 7), (1, 6), (4, 11). Find the standard error of estimate.arrow_forwardConsider the following. (-3,2) 1.5 (-1, 0) 0.5 (1,1) (a) Find the least squares regression line. y = (3,2) (b) Calculate S, the sum of the squared errors. Use the regression capabilities of a graphing utility to verify your results. S =arrow_forward
 Calculus For The Life SciencesCalculusISBN:9780321964038Author:GREENWELL, Raymond N., RITCHEY, Nathan P., Lial, Margaret L.Publisher:Pearson Addison Wesley,
 Linear Algebra: A Modern IntroductionAlgebraISBN:9781285463247Author:David PoolePublisher:Cengage Learning
 College AlgebraAlgebraISBN:9781305115545Author:James Stewart, Lothar Redlin, Saleem WatsonPublisher:Cengage Learning