Concept explainers
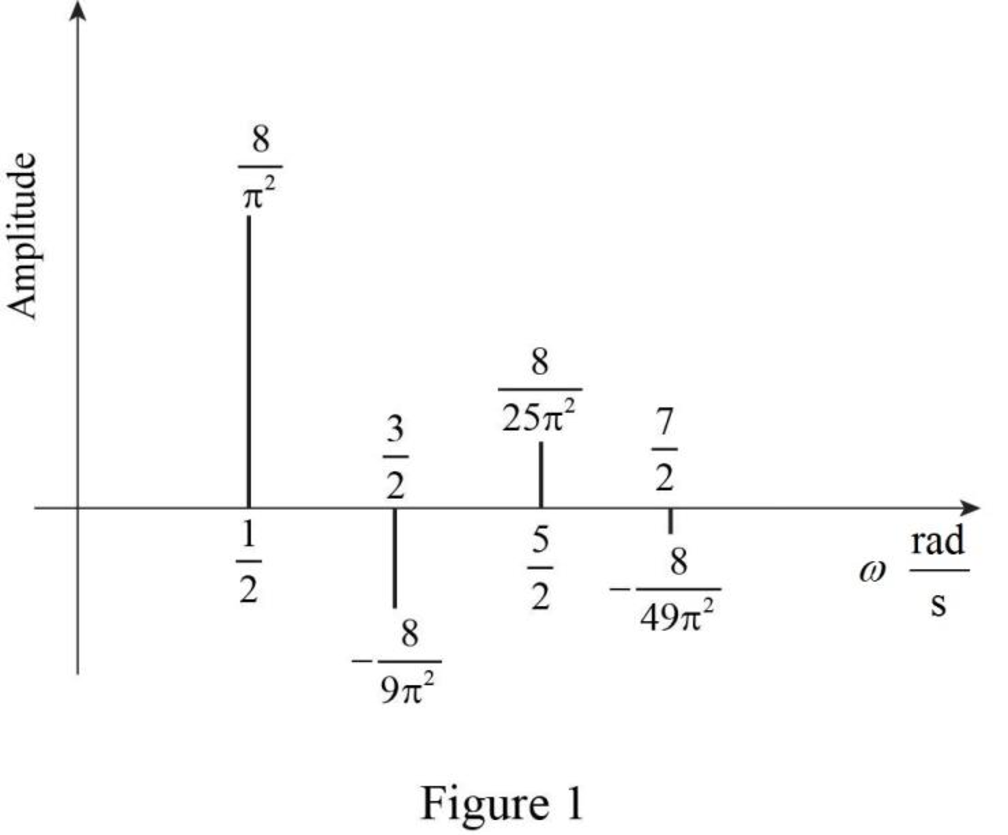
Sketch the line spectrum for the waveform shown in Figure 17.4c (limited to the five largest terms).
Answer to Problem 14E
The line spectrum for the waveform shown in Figure 17.4c is sketched as shown in Figure 1.
Explanation of Solution
Given data:
Refer to Figure 17.4c in the textbook.
Formula used:
Write the general expression for Fourier series expansion.
Write the general expression for Fourier series coefficient
Write the general expression for Fourier series coefficient
Write the general expression for Fourier series coefficient
Write the expression to calculate the fundamental angular frequency.
Here,
Calculation:
In the given Figure 17.4a, the time period is
The function
Substitute 2 for T in equation (5) to find
Applying equation (6) in equation (2) to find
Simplify the above equation as follows,
As the given function is an odd symmetry. Therefore,
Applying equation (6) in equation (4) to finding the Fourier coefficient
Equation (8) is simplified as,
Therefore, equation (8) becomes,
Consider the function,
Consider the following integration formula.
Compare the equations (10) and (11) to simplify the equation (10).
Using the equation (11), the equation (10) can be reduced as,
Simplify the above equation as follows,
Consider the function,
Compare the equations (12) and (11) to simplify the equation (12).
Using the equation (11), the equation (12) can be reduced as,
Simplify the above equation as follows,
Substituting the values of x and y in equation (9) as follows,
Converting the equation (1) which is in angular frequency into frequency.
Substitute the values of
For
For
The sketch for the line spectrum of
Conclusion:
Thus, the line spectrum for the waveform shown in Figure 17.4c is sketched as shown in Figure 1.
Want to see more full solutions like this?
Chapter 17 Solutions
Loose Leaf for Engineering Circuit Analysis Format: Loose-leaf


- Q1) For the following signals determine analytically which are periodic (if periodic, give the period) -) X(t) = e(-1+5j)t -) X[n] = 4cos(zn)arrow_forwardFind the spectrum of the following periodic discrete-time signals (ANSWER ONE ONLY) s(끼) + stn(플m) 1. x(n) = cos 2. x(n) = (-1)", - 00arrow_forwardC3: Given X₁ (n)= (os (211) 8 x₂ (n) = Sin (2002). 1- Determine the fundamental period No. if the Signals are Periodic 2- Determine the overall Fundamental period of No = Nil + N°₂arrow_forwardConsider the oscilloscope figure shown next (with X(t) signal operating at a frequency of 1 KHz). The Y(t) signal is approximately found to be 3.2sin(4TtKt) None of the choices 2.8sin( 3tKt) 3.2sin(6tKt) 2.8sin(2tkt)arrow_forward2. Is the following signal x(t) periodic? If so, then find the fundamental period of x(t). exp (1풍) + exp (/:) 2cos (플) cos (플) + exp (/) i. ii. 8. iii. (-j)st + cosarrow_forward12. (Rectifier) Find the Fourier series of the function obtained by passing the voltage v(t) = Vo cos 100m through a half-wave rectifier. %3Darrow_forwardAssuming that an oscilloscope displays a Vmax of 5.22V and Vmin of 1.33V. Calculate the percentage of modulation. Three (3) AM broadcast stations are spaced at 18 kHz, beginning at 73 kHz. Each station is allowed to transmit modulating up to 6 kHz. Compute for the upper and lower sidebands of each station and plot it in the frequency domain. Given a Vmax of 7.45V and a modulation index of 0.691, calculate for Vmin. A station is given a carrier frequency of 88 kHz. Having a modulating frequency of 12 kHz, compute for the upper and lower sidebands of the station.arrow_forward(A) Explain in details whether or not the following signal is periodic. In case it is periodic, specify its fundamental period. COS x(n) = cos cos cos COS 8arrow_forward2. Determine whether each of the following signals is periodic or not. If a signal is periodic, determine its fundamental period. (a) x(t) = sint; (b) x(t) = cost + sin vZt; (c) x(t) = sin? t; (d) x[n] = cos n+ sinn. !3!arrow_forwarda) i) Sketch (with full labelling) an example of each of a random, energy, power signals. ii) Sketch the following periodic signal: x(t) = A over the period t=0 to t=1 sec, x(t) = 0 over the period t=1 to t=2 sec. %3D and state its mean value.arrow_forwardShow Given signal is periodic or non-periodic? 1. x[n] = [-1]" 2. x(t) = sin²(4nt) Find the Even component and Odd component of given signal. x(t) = cos (wt +) %3D 3.arrow_forwardProvide a reasonable structure that is consistent with each of the following IR spectra and related data. Show your work and your reasoning (i.e., identify major functional groups and and other structural fragments from the spectrum) in order to receive partial creditarrow_forwardarrow_back_iosSEE MORE QUESTIONSarrow_forward_ios
 Introductory Circuit Analysis (13th Edition)Electrical EngineeringISBN:9780133923605Author:Robert L. BoylestadPublisher:PEARSON
 Delmar's Standard Textbook Of ElectricityElectrical EngineeringISBN:9781337900348Author:Stephen L. HermanPublisher:Cengage Learning
 Programmable Logic ControllersElectrical EngineeringISBN:9780073373843Author:Frank D. PetruzellaPublisher:McGraw-Hill Education
 Fundamentals of Electric CircuitsElectrical EngineeringISBN:9780078028229Author:Charles K Alexander, Matthew SadikuPublisher:McGraw-Hill Education
 Electric Circuits. (11th Edition)Electrical EngineeringISBN:9780134746968Author:James W. Nilsson, Susan RiedelPublisher:PEARSON
 Engineering ElectromagneticsElectrical EngineeringISBN:9780078028151Author:Hayt, William H. (william Hart), Jr, BUCK, John A.Publisher:Mcgraw-hill Education,