Mathematics for Elementary Teachers with Activities (5th Edition)
5th Edition
ISBN: 9780134392790
Author: Beckmann, Sybilla
Publisher: PEARSON
expand_more
expand_more
format_list_bulleted
Concept explainers
Videos
Textbook Question
Chapter 15.4, Problem 15P
Compute the mean and the MAD for each of the dot plots in Figure 15.41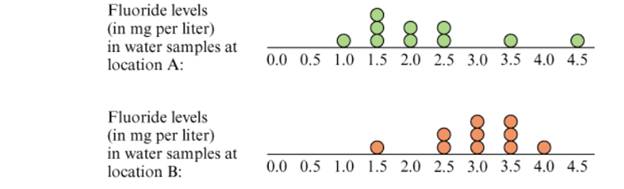
Figure 15.41 Dot plots of fluoride levels in water attwo locations.
b. Use the means and MADs from part (a) to discuss how the fluoride levels at the two locations compare. What do the means tell us? What do the MADs tell us? How confident can we be in distinguishing the levels of fluoride in the water at the two locations?
Expert Solution & Answer
Want to see the full answer?
Check out a sample textbook solution
Students have asked these similar questions
.
3.
41°C 29 30 31
Why is it important to collect more than one set of data for each temperature? Why compute an average temperature?
12.3 MRSA, or Staphylococcus aureus, can cause a serious bacterial infections in hospital patients. Table 12.8 shows
various colony counts from different patients who may or may not have MRSA. The data from the table is plotted in
Figure 12.5.
Conc = 0.6 Conc = 0.8
16
93
82
9
66
98
Table 12.8
Plot of the data for the different concentrations:
Tryptone concentrations
1.4
1.2
1-
0.8
0.6 .
50
Conc = 1.0
22
147
120
Conc = 1.2
30
199
148
100
Colony counts
150
Conc = 1.4
27
168
132
200
Figure 12.5
Test whether the mean number of colonies are the same or are different. Construct the ANOVA table, find the p-value,
and state your conclusion. Use a 5% significance level.
answer III , IV AND V
b) The amount of money earned in a day by Ms. Anne’s craft shop was recorded and displayedin the stem-and-leaf diagram shown below in Exhibit 1.Exhibit 1Stem-and-leaf of Data: Amount of Money earned in a day indollarsLeaf Unit = 10 N = *2 2 595 3 23413 3 55779999(**) 4 000123314 4 5569*** 5 033445 5 77881 6 1(i) What is the range of the distribution? (ii) What are the values of *, ** and ***? (iii) What is the median of the distribution? (iv) Use the stem-and-leaf diagram above to draw a box-and-whisker diagram. (v) Comment on the skewness of the distribution.
Chapter 15 Solutions
Mathematics for Elementary Teachers with Activities (5th Edition)
Ch. 15.1 - Give two examples of a statistical question and...Ch. 15.1 - A class has a collection of 100 bottle caps and...Ch. 15.1 - Neil, a third-grader, asked 10 of his classmates...Ch. 15.1 - An announcer of a TV program invited viewers to...Ch. 15.1 - There is a bowl containing 300 plastic tiles. Some...Ch. 15.1 - There is a bowl containing 80 green tiles and an...Ch. 15.1 - At a factory that produces doorknobs, 1500...Ch. 15.1 - At a factory that produces switches, 3000 switches...Ch. 15.1 - At a light bulb factory, 1728 light bulbs are...Ch. 15.1 - Carter has a large collection of marbles. He knows...
Ch. 15.1 - The following problem is an example of the...Ch. 15.1 - A group studying violence wants to determine the...Ch. 15.2 - Three third-grade classes are having a contest to...Ch. 15.2 - Find 3 coins of any type (as long as all 3 have a...Ch. 15.2 - Table 15.3 shows women’s 400-meter freestyle...Ch. 15.2 - Using an Internet browser, go to census.gov, the...Ch. 15.2 - Using an Internet browser, go to the webpage of...Ch. 15.2 - Using an Internet browser, go to one of the...Ch. 15.2 - Using an Internet browser, go to one of the...Ch. 15.2 - a. Describe in detail an activity suitable for use...Ch. 15.3 - In your own words, explain why the following two...Ch. 15.3 - Explain why the mean of a list of numbers must...Ch. 15.3 - Explain why the mean of two numbers is exactly...Ch. 15.3 - Shante caught 17 ladybugs every day for 4 days....Ch. 15.3 - John’s average annual income over a 4-year period...Ch. 15.3 - Tracy’s times swimming 200 yards were as follows:...Ch. 15.3 - Explain how you can quickly calculate the mean of...Ch. 15.3 - Explain how you can quickly calculate the mean of...Ch. 15.3 - average on her first 3 math tests was 80. Her...Ch. 15.3 - A teacher gives a 10-point test to a class of 10...Ch. 15.3 - In your own words, describe how to view the mean...Ch. 15.3 - Discuss Jessica’s reasoning about calculating the...Ch. 15.3 - ]The dot plot in Figure 15.21 represents the...Ch. 15.3 - For each of the following situations, decide...Ch. 15.3 - A teacher gives a 10-point test to a class of 9...Ch. 15.3 - A teacher gives a 10-point test to a class of 9...Ch. 15.3 - In Ritzy County, the average annual household...Ch. 15.3 - In county A, the average score on the grade 5 Iowa...Ch. 15.3 - a. The histogram at the top of Figure 15.22 shows...Ch. 15.3 - * Ms. Smith needs to figure her students’ homework...Ch. 15.3 - The average speed of a moving object during a...Ch. 15.4 - What is the difference between scoring in the 90th...Ch. 15.4 - What is the purpose of reporting a student’s...Ch. 15.4 - The three histograms in Figure 15.37 show the...Ch. 15.4 - At a math center in a class, there is a bag filled...Ch. 15.4 - Refer to Figure 15.26 on page 706. a. Refer to the...Ch. 15.4 - Refer to Figure 15.26 on page 706. a. Refer to the...Ch. 15.4 - Refer to Figure 15.26 on page 706. a. Write at...Ch. 15.4 - Use the NAEP long-term trend data about...Ch. 15.4 - Determine the median and interquartile range for...Ch. 15.4 - a. Make a box plot for the data in Figure 15.38....Ch. 15.4 - Determine the medians and interquartile ranges for...Ch. 15.4 - a. Make box plots for the dot plots in Figure...Ch. 15.4 - A fifth-grade class is wondering ¡f girls’ names...Ch. 15.4 - Compute the mean and the MAD for each of the dot...Ch. 15.4 - On a state-wide test graded on a 10-point scale,...Ch. 15.4 - A 400-point test is given to a group of students....
Knowledge Booster


Learn more about
Need a deep-dive on the concept behind this application? Look no further. Learn more about this topic, subject and related others by exploring similar questions and additional content below.Similar questions
- Refer to Figure 29-9 to determine the values in the table. Allowance is equal to the maximum interference. All dimensions are in millimetersarrow_forwardWhich of the following is (are) TRUE about the arcsine transformation? It is used for percentage data that are based on counts. It is recommended for percentage data ranging from 30% to 70% . A. I onlyB. II onlyC. Both I and IID. Neither I nor II Which of the following is (are) TRUE about the arcsine transformation? Proportions or percentage should be based on equal number of trials. Adjustments must be made for 0% and 100% which depend on the number of trials A. I onlyB. II onlyC. Both I and IID. Neither I nor II 33. Which of the following is (are) TRUE about the square root transformation? It is used for percentage data that range from 0 to 30 or 70 to 100% It is recommended for small whole numbers like counts of rare events A. I only B. II only C. Both I and II D. Neither I nor II Which of the following is (are) TRUE when variances are heterogeneous across treatments? Transformation works when there is a mean-variance relationship. Error partitioning…arrow_forwardFor making a scatter plot of the data set, which would be the best scale and interval for the axis that represents the amount of fluoride?arrow_forward
- Illustration 8.7. Present the data of Table 8.8 by a suitable histo gram. TABLE 8.8. AVERAGE MONTHLY EARNING OF 1035 EMPLOYEES IN CONSTRUCTION INDUSTRY Monthly earnings Number of Frequency density of Workers (per Rs 10 of earning) workers 60-70 25 25 70-80 100 100 0-90 150 150 90-100 200 200 100-120 240 120 120-140 160 80 140-150 50 50 150-180 90 30 180 or more 20arrow_forwardILLUSTRATION 22. Two brands of tyres are tested with the following results: life(in 1000 miles) Brand of tyres X Y 20-25 1 0 25-30 22 24 30-35 64 76 35-40 10 0 40-45 3 0 Question 1. Which brand of tyres between x and y have greater average life? Question 2. Compare the variability and the state of which the brand of tyres would use on your trucks?arrow_forwardSamples are collected from the River X and pH values are observed. 9 different pH values are listed in table 3. Table 3 Concentrations 4.2 Draw box plot and find a. Bowley's coefficient of skewness b. Karl Pearson's coefficient of skewness c. Third moment 3.8 6.0 3.5 8.1 4.9 4.1 3.2 4.0arrow_forward
- Exhibit 10-11 An insurance company selected samples of clients under 18 years of age and over 18 and recorded the number of accidents they had in the previous year. The results are shown below. Under Age 18 Over Age 18 N1 = 500 n2 = 600 Number of accidents = 180 Number of accidents = 150 We are interested in determining if the accident proportions differ between the two age groups. Refer to Exhibit 10-11. The value of the test statistic is .96 1.96 2.96 О 3.96arrow_forwardThe temperature of a certain chemical process is thought to be related to the time it takes for the process to reach completion. Out goal is to that relationship so that we can use it to predict TIME TO REACH COMPLETION at various TEMPERATURES. 14 trials are set up and the time for the process to complete is measured for each of the different temperatures. The data is presented here:(data is in the image added to the question as well as more questions to answer)arrow_forwardQUESTION 19 What is the value of SP for the following set of data? X Y1 4 2 4 9 1 a. SP = 15 b. SP = -5 c. SP = -15 d. SP = 5arrow_forward
arrow_back_ios
arrow_forward_ios
Recommended textbooks for you
 Algebra & Trigonometry with Analytic GeometryAlgebraISBN:9781133382119Author:SwokowskiPublisher:Cengage
 Mathematics For Machine TechnologyAdvanced MathISBN:9781337798310Author:Peterson, John.Publisher:Cengage Learning,
 College Algebra (MindTap Course List)AlgebraISBN:9781305652231Author:R. David Gustafson, Jeff HughesPublisher:Cengage Learning
 Functions and Change: A Modeling Approach to Coll...AlgebraISBN:9781337111348Author:Bruce Crauder, Benny Evans, Alan NoellPublisher:Cengage Learning
 Glencoe Algebra 1, Student Edition, 9780079039897...AlgebraISBN:9780079039897Author:CarterPublisher:McGraw Hill
Algebra & Trigonometry with Analytic Geometry
Algebra
ISBN:9781133382119
Author:Swokowski
Publisher:Cengage
Mathematics For Machine Technology
Advanced Math
ISBN:9781337798310
Author:Peterson, John.
Publisher:Cengage Learning,
College Algebra (MindTap Course List)
Algebra
ISBN:9781305652231
Author:R. David Gustafson, Jeff Hughes
Publisher:Cengage Learning
Functions and Change: A Modeling Approach to Coll...
Algebra
ISBN:9781337111348
Author:Bruce Crauder, Benny Evans, Alan Noell
Publisher:Cengage Learning
Glencoe Algebra 1, Student Edition, 9780079039897...
Algebra
ISBN:9780079039897
Author:Carter
Publisher:McGraw Hill
Mod-01 Lec-01 Discrete probability distributions (Part 1); Author: nptelhrd;https://www.youtube.com/watch?v=6x1pL9Yov1k;License: Standard YouTube License, CC-BY
Discrete Probability Distributions; Author: Learn Something;https://www.youtube.com/watch?v=m9U4UelWLFs;License: Standard YouTube License, CC-BY
Probability Distribution Functions (PMF, PDF, CDF); Author: zedstatistics;https://www.youtube.com/watch?v=YXLVjCKVP7U;License: Standard YouTube License, CC-BY
Discrete Distributions: Binomial, Poisson and Hypergeometric | Statistics for Data Science; Author: Dr. Bharatendra Rai;https://www.youtube.com/watch?v=lHhyy4JMigg;License: Standard Youtube License