
Concept explainers
Videos
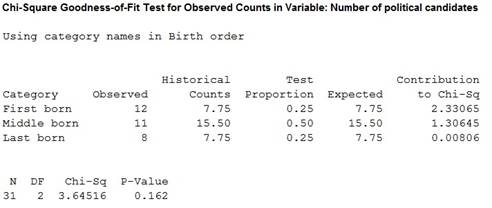
The article “Birth Order and Political Success” (Psych. Reports, 1971: 1239–1242) reports that among 31 randomly selected candidates for political office who came from families with four children, 12 were firstborn, 11 were middle born, and 8 were last born. Use this data to test the null hypothesis that a political candidate from such a family is equally likely to be in any one of the four ordinal positions.
Test the null hypothesis that the political candidate from a family with four children is equally likely within one of the four positions.
Answer to Problem 37SE
There is sufficient evidence to conclude that political candidate from a family with four children is equally likely within one of the four positions.
Explanation of Solution
Given info:
A study conducted with 31 political candidates states the 12 candidates were firstborn, 11 candidates were middle born and 8 candidates were last born.
Calculation:
The claim is to test whether the political candidate from a family with four children is equally likely within one of the four positions. If the claim is rejected, then the political candidate from a family with four children is not equally likely within one of the four positions.
A family with four children has first, second, third and fourth child. For an equally likely event the probability would be
Testing the hypothesis:
Null hypothesis:
That is, the political candidate in a four children family is equally likely to occur.
Alternative hypothesis:
That is, the observed proportion for at least one category is not equal to the expected proportion.
Expected frequency:
The expected frequency for each group is calculated as follows,
Where,
n is the total number of observed frequency.
The expected frequency for the first category:
The expected frequency for the second category:
The expected frequency for the third category:
Test statistic:
Software procedure:
Step-by-step procedure to obtain the test statistic using MINITAB is given below:
- Choose Stat > Tables > Chi-Square Goodness-of-Fit Test (One Variable).
- In Observed counts, enter the column of Number of political candidates.
- In Category names, enter the column of Birth order.
- Under Test, select the column of Expected frequency in Proportions specified by historical counts.
- Click OK.
Output obtained from MINITAB is given below:
Decision rule:
If
If
Conclusion:
The P-value is 0.162 and the level of significance is 0.10.
The P-value is greater than the level of significance.
That is,
Hence, the null hypothesis is not rejected.
Thus, there is sufficient evidence to conclude that the political candidate from a family with four children is equally likely within one of the four positions.
Want to see more full solutions like this?
Chapter 14 Solutions
Bundle: Probability and Statistics for Engineering and the Sciences, 9th + WebAssign Printed Access Card for Devore's Probability and Statistics for ... and the Sciences, 9th Edition, Single-Term


 Holt Mcdougal Larson Pre-algebra: Student Edition...AlgebraISBN:9780547587776Author:HOLT MCDOUGALPublisher:HOLT MCDOUGAL
 Calculus For The Life SciencesCalculusISBN:9780321964038Author:GREENWELL, Raymond N., RITCHEY, Nathan P., Lial, Margaret L.Publisher:Pearson Addison Wesley,
 College Algebra (MindTap Course List)AlgebraISBN:9781305652231Author:R. David Gustafson, Jeff HughesPublisher:Cengage Learning