
Managerial Accounting
15th Edition
ISBN: 9781337912020
Author: Carl Warren, Ph.d. Cma William B. Tayler
Publisher: South-Western College Pub
expand_more
expand_more
format_list_bulleted
Concept explainers
Videos
Textbook Question
Chapter 14, Problem 2TIF
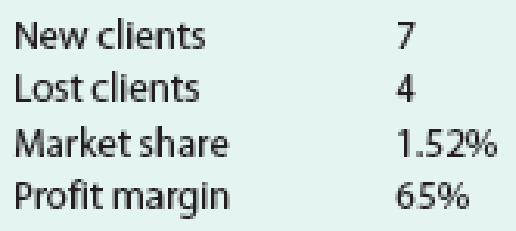
Blake & McKenzie Tax Services is a company serving 72 clients (as of the beginning of last month) that is working on reorganizing its balanced scorecard. Currently, the company has the following performance metrics: online client satisfaction rating, client growth percentage (the number of total clients at the beginning of the current month compared to the number of total clients at the beginning of the prior month), market share, and profit margin. The company tracks these metrics from month to month. The company’s target client growth percentage is 4% per month. Its target average online client satisfaction rating is 4.8 stars. Last month, the company noted the following data related to these metrics:
- a. Working together in teams, create strategic objectives that each of the company’s four performance metrics might represent.
- b. Determine whether the company achieved its client growth percentage target last month.
- c. Suppose that last month, the company received 55 five-star reviews, 10 four-star reviews, 3 three-star reviews, 1 two-star review, and 1 one-star review (some clients did not submit a review). Determine whether the company met its average online client satisfaction rating target.
- d. Come up with at least one strategic initiative for the strategic objective of any performance metric target that you know the company did not meet last month.
Expert Solution & Answer
Want to see the full answer?
Check out a sample textbook solution
Students have asked these similar questions
You have recently been appointed as the accountant attached to the head office of the company with the specific responsibility of monitoring the performance of the companies within the group. Each company is treated as an investment center and every month produces an operating statement for the group headquarters. Summaries of the statements for companies A and B which make similar products selling at similar prices for the last month showed a typical situation.
Extract from the company monthly operating statements.
A B
GHS000 GHS000
Sales 600 370
Less variable cost 229 208
Contribution 371 162
Less controllable fixed overheads…
Brookbury Accounting completed 150 tax returns in the month of March. Its Effective Capacity is 170 tax returns and its Design Capacity is 175 tax returns. Calculate the Efficiency and Utilization for Brookbury Accounting. What do these two numbers tell you?
Performance Aid, Inc. has two divisions: Test Preparation and Language Arts. Results (in millions) for the past three years are partially displayed here:
Q.Use the DuPont method of profitability analysis to explain changes in the operating-income-to-totalassets ratios over the 2015–2017 period for each division and for Performance Aid as a whole. Comment on the results.
Chapter 14 Solutions
Managerial Accounting
Ch. 14 - How does a strategic performance measurement...Ch. 14 - What is the difference between a leading indicator...Ch. 14 - Prob. 3DQCh. 14 - Prob. 4DQCh. 14 - What do strategy maps show, and how do they add...Ch. 14 - Prob. 6DQCh. 14 - Prob. 7DQCh. 14 - Prob. 8DQCh. 14 - How is sustainability distinguishable from...Ch. 14 - How can the balanced scorecard be used to address...
Ch. 14 - 72 Inc. has developed a balanced scorecard with...Ch. 14 - Bluetiful Inc. has the following strategic...Ch. 14 - Moses Moonrocks Inc. has developed a balanced...Ch. 14 - Prob. 4BECh. 14 - Lonnies Shipping Co. is considering switching to...Ch. 14 - Henrys Cafe is a local restaurant that is growing...Ch. 14 - American Express Company is a major financial...Ch. 14 - Eat-n-Run Inc. owns and operates 10 food trucks...Ch. 14 - Prob. 4ECh. 14 - Prob. 5ECh. 14 - The following is the balanced scorecard for Smith...Ch. 14 - Grand Grocery developed a balanced scored with six...Ch. 14 - Coulson and Company is a large retail business...Ch. 14 - Rizzo Goal Inc. produces and sells hockey...Ch. 14 - Silver Lining Inc. has a balanced scorecard with a...Ch. 14 - Two departments within Cougar Gear Inc. are...Ch. 14 - Sunny Nights Inc. is completely powered by the...Ch. 14 - Instructions 1. Label each element of the balanced...Ch. 14 - Strategic initiatives and CSR Get Hitched Inc. is...Ch. 14 - Prob. 3PACh. 14 - Instructions 1. Based on the balanced scorecard...Ch. 14 - Strategic initiatives and CSR Blue Skies Inc. is a...Ch. 14 - Eye Swear Inc. has a balanced scorecard that...Ch. 14 - Den-Tex Company is evaluating a proposal to...Ch. 14 - Analyze CSR initiatives at Boxwood Company Boxwood...Ch. 14 - Analyze CSR initiatives at Green Manufacturing...Ch. 14 - Prob. 1TIFCh. 14 - Blake McKenzie Tax Services is a company serving...Ch. 14 - Young Manufacturing Company is a startup...Ch. 14 - The fundamental concept behind strategic...Ch. 14 - Which of the following statements regarding the...Ch. 14 - The balanced scorecard provides an action plan for...Ch. 14 - Which of the following statements best describes...Ch. 14 - A sign of the successful implementation of a...
Knowledge Booster


Learn more about
Need a deep-dive on the concept behind this application? Look no further. Learn more about this topic, accounting and related others by exploring similar questions and additional content below.Similar questions
- The following revenue data were taken from the December 31, 2017, General Electric annual report (10-K): For each segment and each year, calculate intersegment sales (another name for transfer sales) as a percentage of total sales. Using Microsoft Excel or another spreadsheet application, create a clustered column graph to show the 2016 and 2017 percentages for each division. Comment on your observations of this data. How might a division sales manager use this data?arrow_forwardThe following table shows monthly revenue for six different web development companies. a. Use Excel to create sparklines for sales at each company. b. Which companies have generally decreasing revenues over the six months? Which company has exhibited the most consistent growth over the six months? Which companies have revenues that are both increasing and decreasing over the six months? c. Use Excel to create a heat map for the revenue of the six companies. Do you find the heat map or the sparklines to be better at communicating the trend of revenues over the six months for each company? Why?arrow_forwardFinancial information for BDS Enterprises for the year-ended December 31, 20xx, was gathered from an accounting intern, who has asked for your guidance on how to prepare an income statement format that will be distributed to management. Subtotals and totals are included in the information, but you will need to calculate the values. A. In the correct format, prepare the income statement using the following information: B. Calculate the profit margin, return on investment, and residual income. Assume an investment base of $100,000 and 6% cost of capital. C. Prepare a short response to accompany the income statement that explains why uncontrollable costs are included in the income statement.arrow_forward
- 72 Inc. has developed a balanced scorecard with the following performance metrics: Total sales Employee turnover Market share Number of shipping errors Median training hours per employee Number of new customers Relative to the metric customer satisfaction ratings, which of these performance metrics are leading indicators and which are lagging indicators?arrow_forwardThe following revenue data were taken from the December 31, 2017, Coca-Cola annual report (10-K): For each segment and each year, calculate intersegment sales (another name for transfer sales) as a percentage of total sales, Using Microsoft Excel or another spreadsheet application, create a clustered column graph to show the 2016 and 2017 percentages for each division. Comment on your observations of this data. How might a division sales manager use this data?arrow_forwardEvaluate the two departments for Moxie Products. Compare the years performance of the two departments in terms of ROI and RI. Which department has created the most wealth for Moxie shareholders in the past year?arrow_forward
- Ross Company implemented a quality improvement program and tracked the following for the five years: By cost category as a percentage of sales for the same period of time: Required: 1. Prepare a bar graph that reveals the trend in quality cost as a percentage of sales (time on the horizontal axis and percentages on the vertical). Comment on the message of the graph. 2. Prepare a bar graph for each cost category as a percentage of sales. What does this graph tell you? 3. What if management would like to have the trend in relative distribution of quality costs? Express this as a bar graph and comment on its significance.arrow_forwardBruin Wholesale has gathered the following data on the number of shipments received and the cost of receiving reports for the first seven weeks of 2010. Number of Shipment Received Weekly Cost of Receiving Reports 50 $175 44 162 40 154 35 142 53 185 58 200 60 202 a. Using the high-low method, develop the equation for predicting weekly receiving report costs based on the number of shipments received. b. What is the predicted amount of receiving report costs for a week in which 72 shipments are received? c. What are the concerns you have regarding your prediction from part (b)?arrow_forwardCreate an appropriate graph to show the correlation between the total revenuegenerated by Tesco and the number of its stores over the last recorded fiveyears?arrow_forward
- The following table shows monthly revenue for six different web development companies. a. Use Excel to create sparklines for sales at each company.b. Which companies have generally decreasing revenues over the six months? Whichcompany has exhibited the most consistent growth over the six months? Which companieshave revenues that are both increasing and decreasing over the six months?c. Use Excel to create a heat map for the revenue of the six companies. Do you find theheat map or the sparklines to be better at communicating the trend of revenues overthe six months for each company? Why?arrow_forwardWhich of the following best describes trend analysis? A comparing a company's financial statements with that of other companies B expressing each financial statement amount as a percentage of a budgeted amount C expressing each year's financial statement amounts as a percentage of the base year amounts D calculating key ratios to evaluate performancearrow_forwardA marketing professor at Givens College is interested in the relationship between hours spent studying and total points earned in a course. Data collected on 156 students who took the course last semester are provided in the tile MktHrsPts. Develop a scatter chart for these data. What does the scatter chart indicate about the relationship between total points earned and hours spent studying? Develop an estimated regression equation showing how total points earned is related to hours spent studying. What is the estimated regression model? Test whether each of the regression parameters β0 and β1 is equal to zero at a 0.01 level of significance. What are the correct interpretations of the estimated regression parameters? Are these interpretations reasonable? How much of the variation in the sample values of total point earned does the model you estimated in part (b) explain? Mark Sweeney spent 95 hours studying. Use the regression model you estimated in part (b) to predict the total points Mark earned.arrow_forward
arrow_back_ios
SEE MORE QUESTIONS
arrow_forward_ios
Recommended textbooks for you
 Managerial AccountingAccountingISBN:9781337912020Author:Carl Warren, Ph.d. Cma William B. TaylerPublisher:South-Western College Pub
 Financial And Managerial AccountingAccountingISBN:9781337902663Author:WARREN, Carl S.Publisher:Cengage Learning,
 Excel Applications for Accounting PrinciplesAccountingISBN:9781111581565Author:Gaylord N. SmithPublisher:Cengage Learning
 Essentials of Business Analytics (MindTap Course ...StatisticsISBN:9781305627734Author:Jeffrey D. Camm, James J. Cochran, Michael J. Fry, Jeffrey W. Ohlmann, David R. AndersonPublisher:Cengage Learning
 Cornerstones of Cost Management (Cornerstones Ser...AccountingISBN:9781305970663Author:Don R. Hansen, Maryanne M. MowenPublisher:Cengage Learning
 Principles of Accounting Volume 2AccountingISBN:9781947172609Author:OpenStaxPublisher:OpenStax College
Managerial Accounting
Accounting
ISBN:9781337912020
Author:Carl Warren, Ph.d. Cma William B. Tayler
Publisher:South-Western College Pub
Financial And Managerial Accounting
Accounting
ISBN:9781337902663
Author:WARREN, Carl S.
Publisher:Cengage Learning,
Excel Applications for Accounting Principles
Accounting
ISBN:9781111581565
Author:Gaylord N. Smith
Publisher:Cengage Learning
Essentials of Business Analytics (MindTap Course ...
Statistics
ISBN:9781305627734
Author:Jeffrey D. Camm, James J. Cochran, Michael J. Fry, Jeffrey W. Ohlmann, David R. Anderson
Publisher:Cengage Learning
Cornerstones of Cost Management (Cornerstones Ser...
Accounting
ISBN:9781305970663
Author:Don R. Hansen, Maryanne M. Mowen
Publisher:Cengage Learning
Principles of Accounting Volume 2
Accounting
ISBN:9781947172609
Author:OpenStax
Publisher:OpenStax College
Cost Accounting - Definition, Purpose, Types, How it Works?; Author: WallStreetMojo;https://www.youtube.com/watch?v=AwrwUf8vYEY;License: Standard YouTube License, CC-BY