
Managerial Accounting (5th Edition)
5th Edition
ISBN: 9780134128528
Author: Karen W. Braun, Wendy M. Tietz
Publisher: PEARSON
expand_more
expand_more
format_list_bulleted
Videos
Textbook Question
Chapter 14, Problem 14.2SE
Find trend percentages (Learning Objective 1)
Bradley Group reported the following revenues and net income amounts:
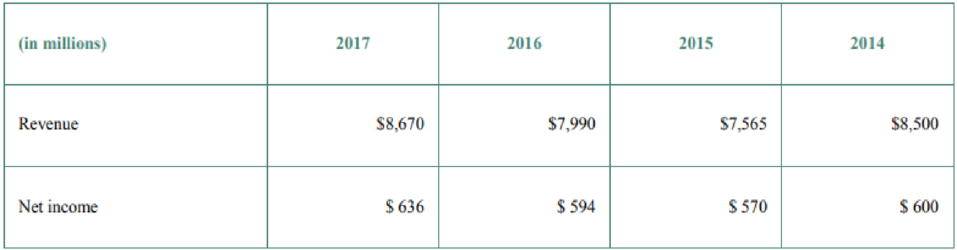
- a. Show Bradley Group’s trend percentages for revenues and net income, Use 2014 as the base year and round to the nearest percent.
- b. Which measure increased faster during 2015–2017?
Expert Solution & Answer
Want to see the full answer?
Check out a sample textbook solution
Students have asked these similar questions
(Learning Objective 7: Calculate return on assets) Hometown Supply Companyreported the following information in its comparative financial statements for the fiscal yearended January 31, 2018:January 31,2018January 31,2017Net sales....................................Net earnings..............................Average total assets...................$84,000$ 4,200$70,000$82,600$ 4,050$69,450Requirements1. Compute the net profit margin ratio for the years ended January 31, 2018, and 2017. Did itimprove or worsen in 2018?2. Compute asset turnover for the years ended January 31, 2018, and 2017. Did it improve orworsen in 2018?3. Compute return on assets for the years ended January 31, 2018, and 2017. Did it improveor worsen in 2018? Which component—net profit margin ratio or asset turnover—wasmostly responsible for the change in the company’s return on assets?
E12-24B Vertical analysis (Learning Objective 2) 15-20 min.
Simpson Painting, Inc., requested that you perform a vertical analysis
of its balance sheet to determine the component percentages of its
assets, liabilities, and stockholders' equity. Round to the nearest tenth
of a percent.
P. Donnelly, Inc.
Comparative Income Statement
Years Ended December 31, 2018 and 2017
Revenue
Expenses:
Cost of Goods Sold
Selling and General Expenses
Interest Expense
Income Tax Expense
Total Expenses
Net Income
2018
$500,000
$245,000
111,000
10,000
54,700
420,700
$ 79,300
2017
$439,500
$236,000
103,500
6,500
44,400
390,400
$ 49,100
(Learning Objective 7: Calculate return on assets) Handley Grocery Corporationreported the following information in its comparative financial statements for the fiscal yearended January 31, 2018:January 31,2018January 31,2017Net sales....................................Net earnings..............................Average total assets...................$50,000$ 2,200$40,000$48,350$ 2,100$39,300Requirements1. Compute the net profit margin ratio for the years ended January 31, 2018, and 2017. Did itimprove or worsen in 2018?2. Compute asset turnover for the years ended January 31, 2018, and 2017. Did it improve orworsen in 2018?3. Compute return on assets for the years ended January 31, 2018, and 2017. Did it improveor worsen in 2018? Which component—net profit margin ratio or asset turnover—wasmostly responsible for the change in the company’s return on assets?
Chapter 14 Solutions
Managerial Accounting (5th Edition)
Ch. 14 - (Learning Objective 1) Which of the following...Ch. 14 - Prob. 2QCCh. 14 - Prob. 3QCCh. 14 - Prob. 4QCCh. 14 - (Learning Objective 3) Which of the following is...Ch. 14 - (Learning Objective 4) Working capital is defined...Ch. 14 - Prob. 7QCCh. 14 - Prob. 8QCCh. 14 - Prob. 9QCCh. 14 - Prob. 10QC
Ch. 14 - Prob. 14.1SECh. 14 - Find trend percentages (Learning Objective 1)...Ch. 14 - Prob. 14.3SECh. 14 - Prepare common-size income statements (Learning...Ch. 14 - Analyze common-size income statements (Learning...Ch. 14 - Cartwrights Data Set used for S14-6 through...Ch. 14 - Cartwrights Data Set used for S14-6 through...Ch. 14 - Cartwrights Data Set used for S14-6 through...Ch. 14 - Prob. 14.9SECh. 14 - Prob. 14.10SECh. 14 - Prob. 14.11SECh. 14 - Prob. 14.12AECh. 14 - Prob. 14.13AECh. 14 - Prob. 14.14AECh. 14 - Prob. 14.15AECh. 14 - Prob. 14.16AECh. 14 - Calculate ratios (Learning Objective 4) Kelleher...Ch. 14 - Prob. 14.18AECh. 14 - Prob. 14.19AECh. 14 - Prob. 14.20AECh. 14 - Prob. 14.21AECh. 14 - Classify company sustainability measurements into...Ch. 14 - Prob. 14.23BECh. 14 - Prob. 14.24BECh. 14 - Prob. 14.25BECh. 14 - Prob. 14.26BECh. 14 - Prob. 14.27BECh. 14 - Calculate ratios (Learning Objective 4) Ponderosa...Ch. 14 - Prob. 14.29BECh. 14 - Prob. 14.30BECh. 14 - Prob. 14.31BECh. 14 - Calculate ratios (Learning Objective 4) Thornton...Ch. 14 - Prob. 14.33BECh. 14 - Prob. 14.34APCh. 14 - Comprehensive analysis (Learning Objectives 2, 3, ...Ch. 14 - Prob. 14.36APCh. 14 - Ratio analysis over two years (Learning Objective...Ch. 14 - Prob. 14.38APCh. 14 - Prob. 14.39BPCh. 14 - Prob. 14.40BPCh. 14 - Prob. 14.41BPCh. 14 - Ratio analysis over two years (Learning Objective...Ch. 14 - Make an investment decision (Learning Objective 4)...Ch. 14 - Prob. 14.44SCCh. 14 - Discussion Questions 1. Describe horizontal...Ch. 14 - Prob. 14.47ACTCh. 14 - Using financial statement ratios to analyze...
Knowledge Booster


Learn more about
Need a deep-dive on the concept behind this application? Look no further. Learn more about this topic, accounting and related others by exploring similar questions and additional content below.Similar questions
- (Learning Objective 7: Evaluate liquidity using the quick [acid-test] ratio and days’sales in receivables) Northern Products reported the following amounts in its 2019 financialstatements. The 2018 amounts are given for comparison.2019 2018Current assets:Cash............................................ $ 9,500Short-term investments................ 7,000Accounts receivable..................... $70,100Less: Allowance foruncollectibles.......................$86,500(7,500) (5,500) 64,600Inventory..................................... 190,000Prepaid insurance ........................ 2,200Total current assets..................... 273,300Total current liabilities.................... 106,000Net sales (all on account) ................$ 9,50010,50079,000189,0002,200290,20099,0001,077,000 734,000Requirements1. Compute Northern’s quick (acid-test) ratio at the end of 2019. Round to two decimalplaces. How does the quick ratio compare with the industry average of 0.92?2. Compare days’ sales…arrow_forward1. Using the data in the student spreadsheet file Ethan Allen Financials.xlsx forecast the 2019 income statement and balance sheet for Ethan Allen. Use the percent of sales method and the following assumptions: (1) sales in FY 2019 will be $797.3359; (2) the tax rate will be 35%; (3) each item that changes with sales will be the five-year average percentage of sales; (4) net fixed assets will increase to $300; and (5) the common dividend will be $0.75 per share. Use your judgment on all other items. a. What is the discretionary financing needed in 2019? Is this a surplus or deficit? b. Assume that the DFN will be absorbed by long-term debt and that the interest rate is 4% of LTD. Set up an iterative worksheet to eliminate it.arrow_forwardOBJECTIVE: To enable learners to utilize financial ratios as a mechanism to evaluate the firm's financial performance and identify areas for making decisions for improvement REQUIREMENT: Financial Statement Analysis Question Refer to the following financial statements of Delima Corporation for 2019 and 2020: Delima Corporation Income Statements For the year ended 31 December (in millions) 2020 $13,198 7,750 2019 $12,397 7,108 Net sales Cost of goods sold Gross profit Selling and administrative expenses Income from operations 5,448 5,289 3,472 3,299 1,976 1,990 Interest expense 233 248 Other (income) expense, net 11 1,732 503 1,229 Income before income taxes 1,742 Income tax expense 502 Net income 1,240 Delima Corporation Balance Sheets 31 December (in millions) 2020 2019 Assets Current assets Cash $460 $444 Accounts receivables (net) 1,188 1,132 1,190 1,056 225 2,915 3,128 Inventories Other current assets 247 Total current assets 3,027 3,281 Property (net) 5,593 $11,901 Other assets…arrow_forward
- The Dean of the School of Business and Economics is forecasting the total student enrollment for the year based on the following historical data. Based on this data, what is this year's forecast using a three-period simple moving average? Historical enrollment dataarrow_forwardE1-23A. (Learning Objective 4: Identify financial statement by type of information) ButlerTech, Inc., is expanding into India. The company must decide where to locate and how tofinance the expansion. Identify the financial statement where these decision makers can findthe following information about Butler Tech, Inc. In some cases, more than one statement willreport the needed data.a. Revenueb. Common stockc. Current liabilitiesd. Long-term debte. Dividendsf. Ending cash balanceg. Adjustments to reconcile net income tonet cash provided by operationsh. Cash spent to acquire the buildingi. Income tax expensej. Ending balance of retained earningsk. Selling, general, and administrativeexpensel. Total assetsm. Net incomen. Income tax payablearrow_forward(Learning Objective 7: Calculate return on assets) Oscar Optical Corporation providesa full line of designer eyewear to consumers. Oscar reported the following information for 2018and 2017:2018 2017Sales revenue ...............................Net income..................................Average total assets.....................$500,000$ 43,700$230,000$410,000$ 34,650$210,000Compute return on assets (ROA) for 2018 and 2017. Using the DuPont model, identify thecomponents and state whether each improved or worsened from 2017 to 2018.arrow_forward
- (Learning Objective 4: Construct the financial statements) Suppose Robin SportingGoods Company reported the following data at July 31, 2018, with amounts in thousands:Cost of goods sold................. $136,800Cash...................................... 50,000Property and equipment, net ... 19,400Common stock...................... 26,000Inventories ............................ 36,000Long-term liabilities.............. 11,700Dividends.............................. 0Retained earnings,July 31, 2017 ............ $ 31,500Accounts receivable....... 34,000Net revenues ................. 191,000Total current liabilities.. 80,000All other expenses......... 29,000Other current assets ...... 5,000Other assets................... 30,000Use these data to prepare Robin Sporting Goods Company’s single-step income statement forthe year ended July 31, 2018; statement of retained earnings for the year ended July 31, 2018;and classified balance sheet at July 31, 2018. Use the report format for the balance…arrow_forward(Learning Objective 2: Analyze accounts payable turnover) Barnacle Sales, Inc.’s,comparative income statements and balance sheets show the following selected information for2017 and 2018:2018$2,850,000$ 800,000$ 600,000$ 305,0002017$2,700,000$ 600,000$ 400,000$ 255,000Cost of goods sold.......................................................Ending inventory.........................................................Beginning inventory ....................................................Average accounts payable ...........................................Requirements1. Calculate the company’s accounts payable turnover and days’ payable outstanding (DPO)for 2017 and 2018.2. On the basis of this computation alone, has the company’s liquidity position improved ordeteriorated during 2018?arrow_forwardIncome and Education. Using Exhibit 1.8, discuss the relationship between annual income and the highest level of education completed. Provide specific examples of the difference between having no high school diploma and having a bachelors degree, and between having a bachelors degree and a professional degree.arrow_forward
- Compute trend percentages forRolling Hills Realtors' net revenue and net income for the following five-year period, using 2016 as the base year. Which grew faster during the period, net revenue or net income? Enter trend percentage values for net revenue and net income in the table below. (Enter the results as a percentage.) 2020 2019 2018 2017 2016 Net revenue. . . . . . % % % % % Net income. . . . . . . % % % % % Data table (in thousands) 2020 2019 2018 2017 2016 Net revenue. . . . . . $1,271 $1,148 $1,066 $943 $1,025 Net income. . . . . . . $180 $168 $126 $96 $120arrow_forwardCount the average of these weights for all three years. Please note that you are to assign weights of 3, 2 and 1 to the financial ratios for FISCAL YEAR 2019, FISCAL YEAR 2018 and FISCAL YEAR 2017 and then compute the weighted average. Current Ratlo Particulars FY'19 L&T BHEL NBCC 1.3 1.59 1.08 Slemens 191 FY'18 FY'17 132 1.44 1.83 1.96 1.18 1.26 1.82 ▷arrow_forwardYogi has the following financial data: Investment assets at year end Investment assets at beginning of the year Savings made during the year by Yogi Employer match to Yogi's 401(k) plan Total assets on ending statement of financial position Gross income on income statement Total assets on beginning statement of financial position Total liabilities at beginning of year Total liabilities at year end What is Yogi's ROI for the year? O 13.01% O 18.37% 15.56% 4 21.17% $475.000 $392,000 $27,000 $5,000 $700.000 $100,000 $600,000 $200.000 $180,000arrow_forward
arrow_back_ios
arrow_forward_ios
Recommended textbooks for you

 Pfin (with Mindtap, 1 Term Printed Access Card) (...FinanceISBN:9780357033609Author:Randall Billingsley, Lawrence J. Gitman, Michael D. JoehnkPublisher:Cengage Learning
Pfin (with Mindtap, 1 Term Printed Access Card) (...
Finance
ISBN:9780357033609
Author:Randall Billingsley, Lawrence J. Gitman, Michael D. Joehnk
Publisher:Cengage Learning
How To Analyze an Income Statement; Author: Daniel Pronk;https://www.youtube.com/watch?v=uVHGgSXtQmE;License: Standard Youtube License