
Videos
Curing concrete is known to be vulnerable to shock vibrations, which may cause cracking or hidden damage to the material. As part of a study of vibration phenomena, the paper “Shock Vibration Test of Concrete” (ACI Materials J., 2002: 361–370) reported the accompanying data on peak particle velocity (mm/sec) and ratio of ultrasonic pulse velocity after impact to that before impact in concrete prisms.
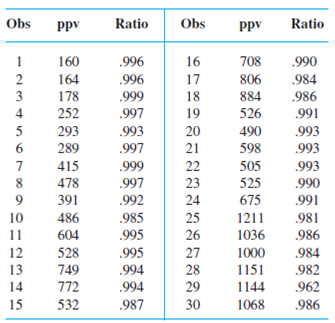
Transverse cracks appeared in the last 12 prisms, whereas there was no observed cracking in the first 18 prisms.
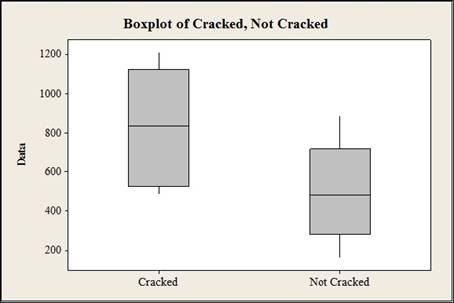
a. Construct a comparative boxplot of ppv for the cracked and uncracked prisms and comment. Then estimate the difference between true average ppv for cracked and uncracked prisms in a way that conveys information about precision and reliability.
b. The investigators fit the simple linear regression model to the entire data set consisting of 30 observations, with ppv as the independent variable and ratio as the dependent variable. Use a statistical software package to fit several different regression models, and draw appropriate inferences.
a.
Construct a comparative boxplot for the given data.
Answer to Problem 65SE
The comparative boxplot is given below:
Explanation of Solution
Given info:
The data shows the ultra sonic pulse velocity ratio before and after impact in concrete prisms for peak velocity. The first 18 observations shows the values before cracking and last 12 observations shows the values after cracking.
Calculation:
Comparative boxplot:
Software procedure:
Step by step procedure to construct the boxplot is given below:
- Choose Graph > Boxplot.
- Under Multiple Y's, choose Simple. Click OK.
- In Graph variables, enter the data of cracked and not cracked.
- Click OK.
Interpretation:
Thus, the box plot is constructed for the cracked ratio and not cracked ratio and the box plot suggests that the ultra sonic pulse velocity ratio for cracked ppv is greater than the ratio of not cracked ppv.
b.
Fit several different regression models and draw conclusions.
Answer to Problem 65SE
The simple linear regression model is given below:
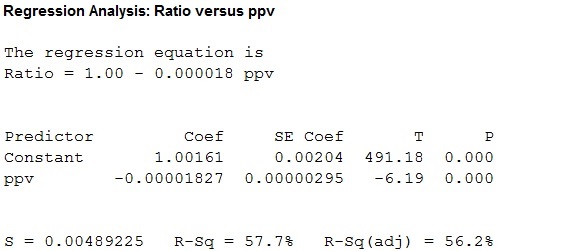
Figure 2
The multiple linear regression model is given below:
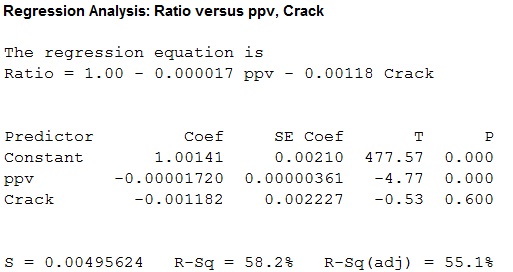
Figure 2
The multiple linear regression model with interaction is given below:
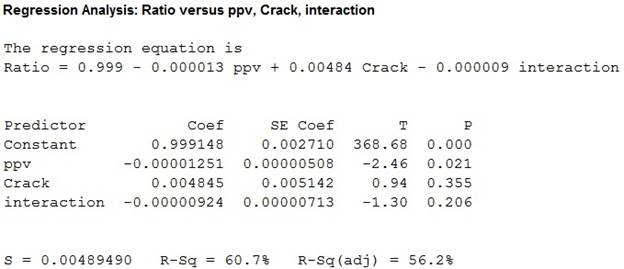
Figure 3
Explanation of Solution
Calculation:
Simple linear regression:
Software procedure:
Step by step procedure to fit a simple linear regression model is given below:
- Click Stat>Regression>Regression.
- Under Response (Y) select the column containing ratio.
- Under Predictor (X) select the column containing ppv.
- Click OK.
Interpretation:
Thus, a simple regression is fitted for the given data, the value of coefficient of determination is 57.7 which tells that the peak particle velocity can explain 57.7% of the variation in ratio of ultrasonic pulse velocity.
Multiple regression model with indicator variable (crack):
The new indicator variable is created by coding the observations with crack as 1 and observations without a crack as 0. Then the multiple regression model is built.
Software procedure:
Step by step procedure to fit a simple linear regression model is given below:
- Click Stat>Regression>Regression.
- Under Response (Y) select the column containing ratio.
- Under Predictor (X) select the column containing ppv, crack.
- Click OK.
Interpretation:
Thus, a multiple regression model is fitted for the given data , the value of coefficient of determination is 58.2 which tells that the peak particle velocity and crack can explain 58.2% of the variation in ratio of ultrasonic pulse velocity.
Multiple regression model with interaction between ppv and indicator variable (crack):
The indication variable is created by multiplying the ppv with indicator variable.
Software procedure:
Step by step procedure to fit a simple linear regression model is given below:
- Click Stat>Regression>Regression.
- Under Response (Y) select the column containing ratio.
- Under Predictor (X) select the column containing ppv, crack and interaction.
- Click OK.
Interpretation:
Thus, a multiple regression model with interaction between crack and ppv is fitted for the given data , the value of coefficient of determination is 60.7 which tells that the peak particle velocity, crack and interaction can explain 60.7% of the variation in ratio of ultrasonic pulse velocity.
The P- value for the individual t statistic corresponding to ppv and interaction are 0.355 and 0.206 which greater than the 5% level of significance.
Conclusion:
The simple linear, multiple linear model and multiple linear model with interaction gives almost the same
Want to see more full solutions like this?
Chapter 13 Solutions
WEBASSIGN ACCESS FOR PROBABILITY & STATS


- The article "Effect of Granular Subbase Thickness on Airfield Pavement Structural Response" (K. Gopalakrishnan and M. Thompson, Journal of Materials in Civil Engineering, 2008:331-342) presents a study of the amount of surface deflection caused by aircraft landing on an airport runway. A load of 160 kN was applied to a runway surface, and the amount of deflection in mm (y) was measured at various distances in m (x) from the point of application. The results are presented in the following table. y 0.000 3.24 0.305 2.36 0.610 1.42 0.914 0.87 1.219 0.54 1.524 0.34 1.830 0.24 a. Fit the linear model y = Bo + B1x + ɛ. For each coefficient, test the hypothesis that the coefficient is equal to 0. b. Fit the quadratic model y = Bo + Bịx + B2x² + ɛ. For each coefficient, test the hypothesis that the coefficient is equal to 0. %3D Fit the cubic model y = Bo + B1x + B2x? + B3x + E. For each coefficient, test the C. hypothesis that the coefficient is equal to 0. d. Which of the models in parts (a)…arrow_forwardThe article “Stochastic Estimates of Exposure and Cancer Risk from Carbon Tetrachloride Released to the Air from the Rocky Flats Plant” (A. Rood, P. McGavran, et al., Risk Analysis, 2001:675–695) models the increase in the risk of cancer due to exposure to carbon tetrachloride as lognormal with μ = −15.65 and σ = 0.79. a) Find the mean risk. b) Find the median risk. c) Find the standard deviation of the risk. d) Find the 5th percentile. e) Find the 95th percentile.arrow_forwardThe article "Modeling of Urban Area Stop-and-Go Traffic Noise" (P. Pamanikabud and C. Tharasawatipipat, Journal of Transportation Engineering, 1999:152–159) presents measurements of traffic noise, in dBA, from 10 locations in Bangkok, Thailand. Measurements, presented in the following table, were made at each location, in both the acceleration and deceleration lanes. Location Acceleration Deceleration 78.1 78.6 78.1 80.0 3 79.6 79.3 4 81.0 79.1 78.7 78.2 78.1 78.0 78.6 78.6 78.5 78.8 78.4 78.0 10 79.6 78.4 Can you conclude that there is a difference in the mean noise levels between acceleration and deceleration lanes?arrow_forward
- In rock blasting, the peak particle velocity (PPV) depends both on the distance from the blast and on the amount of charge. The article "Prediction of Particle Velocity Caused by Blasting for an Infrastructure Excavation Covering Granite Bedrock" (A. Kahriman, Mineral Resources Engineering, 2001:205-218) presents data on PPV, scaled distance (which is equal to the distance divided by the square root of the charge), and the amount of charge. The following table presents the values of PPV, scaled distance, and amount of charge for 15 blasts. Scaled Distance (m/kg0.5) PPV Amount of Charge (mm/s) (kg) 1.4 47.33 4.2 15.7 9.6 92.0 2.54 15.8 40.0 1.14 24.3 48.7 0.889 23.0 95.7 1.65 12.7 67.7 1.4 39.3 13.0 26.8 8.0 70.0 1.02 29.94 13.5 4.57 10.9 41.0 6.6 8.63 108.8 1.02 28.64 27.43 3.94 18.21 59.1 1.4 33.0 11.5 1.4 34.0 175.0 Fit the model In PPV = Bo + B1 In Scaled Distance + B2 In Charge + E. Compute the P- value for testing Ho : B¡ = 0 for Bo. B1, and Bz. b. The article claims that the…arrow_forwardArtificial joints consist of a ceramic ball mounted on a taper. The article "Friction in Orthopaedic Zirconia Taper Assemblies" (W. Macdonald, A. Áspenberg, et al., Proceedings of the Institution of Mechanical Engineers, 2000: 685-692) presents data on the coefficient of friction for a push-on load of 2 kN for taper assemblies made from two zirconium alloys and employing three different neck lengths. Five measurements were made for each combination of material and neck length. The results presented in the following table are consistent with the cell means and standard deviations presented in the article. Тарег Material Neck Length Coefficient of Friction CPTI-ZIO2 CPTI-Z:O, CPTI-Z:O, Long TIAlloy-ZrO, Short TiAlloy-ZrO, Medium TiAlloy-ZrO, Long Short 0.254 0.195 0.281 0.289 0.220 Medium 0.196 0.220 0.185 0.259 0.197 0.329 0.481 0.320 0.296 0.178 0.150 0.118 0.158 0.175 0.131 0.180 0.184 0.154 0.156 0.177 0.178 0.198 0.201 0.199 0.210 Compute the main effects and interactions. Construct…arrow_forwardAn article in the ASCE Journal of Energy Engineering (1999, Vol. 125, pp. 59-75) describes a study of the thermal inertia properties of autoclaved aerated concrete used as a building material. Five samples of the material were tested in a structure, and the average interior temperatures ('C) reported were as follows: 23.01, 22.22, 22.04, 22.62, and 22.59. Test the hypotheses Họ: µ=22.5 versus H1: µz 22.5, using a=0.05. Find the P-value.arrow_forward
- The depth of wetting of a soil is the depth to which water content will increase owing to extemal factors. The article "Discussion of Method for Evaluation of Depth of Wetting in Residential Areas" (J. Nelson, K. Chao, and D. Overton, Journal of Geotechnical and Geoenvironmental Engineering, 2011:293-296) discusses the relationship between depth of wetting beneath a structure and the age of the structure. The article presents measurements of depth of wetting, in meters, and the ages, in years, of 21 houses, as shown in the following table. Age Depth 7.6 4 4.6 6.1 9.1 3 4.3 7.3 5.2 10.4 15.5 5.8 10.7 4 5.5 6.1 10.7 10.4 4.6 7.0 6.1 14 16.8 10 9.1 8.8 Compute the least-squares line for predicting depth of wetting (y) from age (x). b. Identify a point with an unusually large x-value. Compute the least-squares line that results from deletion of this point. Identify another point which can be classified as an outlier. Compute the least-squares line that results from deletion of the outlier,…arrow_forwardA study was performed looking at the risk of fractures in three rural Iowa communities according to whether their drinking water was “higher calcium,” “higher fluorides,” or “control” as determined by water samples. Table 11.10 presents data comparing the rate of fractures (over 5 years) between the higher-calcium vs the control communities for women ages 20–35 and 55–80, respectively . Table 11.10 Relationship of calcium content of drinking water to the rate of fractures in rural Iowa Ages 20-35 Number of women with fractures Total number of women Ages 55-80 Number of woemn with fractures Total number of women Control 3 37 Control 11 121 High calcium 1 33 High calcium 21 148 13.1 What test can be used to compare the fracturerates in these two communities while controlling for age? 13.2 Implement the test in Problem 13.1, report a p-value, and make a conclusion on relationship between drinking water calcium concentration and rate of fracture based on the p-value.arrow_forwardA study was performed looking at the risk of fractures in three rural Iowa communities according to whether their drinking water was “higher calcium,” “higher fluorides,” or “control” as determined by water samples. Table 11.10 presents data comparing the rate of fractures (over 5 years) between the higher-calcium vs the control communities for women ages 20–35 and 55–80, respectively . Table 11.10 Relationship of calcium content of drinking water to the rate of fractures in rural Iowa Ages 20-35 Number of women with fractures Total number of women Ages 55-80 Number of woemn with fractures Total number of women Control 3 37 Control 11 121 High calcium 1 33 High calcium 21 148 13.1 What test can be used to compare the fracturerates in these two communities while controlling for age? 13.2 Implement the test in Problem 13.1, report a p-value, and make a conclusion on relationship between drinking water calcium concentration and rate of fracture based on the p-value. 13.3…arrow_forward
- An artide in the ACI Materials Joumal (vol. 4, 1987, pp. 213-216) describes several experiments investigating the rodding of concrete to remove trapped ar. Anchxinch cylinder was used, and the number of times this rod was used is the design variable. The resulting compresive strength of the concrete specimen is the response. The data are shown n the followng table. Compressive Strength (psi) Rodding Level Observations 10 1530 1530 1440 15 1610 1650 1500 20 1560 1730 1530 25 1500 1490 1510 Calculate the test statistic fo Input answer up to 2 decimal places. TestStatistict- Blank 1 Blank 1 Add your answerarrow_forwardThe body mass index (BMI) of a person is defined to be the person’s body mass divided by the square of the person’s height. The article “Influences of Parameter Uncertainties within the ICRP 66 Respiratory Tract Model: Particle Deposition” (W. Bolch, E. Farfan, et al., Health Physics, 2001:378–394) states that body mass index (in kg/m²) in men aged 25–34 is lognormally distributed with parameters μ = 3.215 and σ = 0.157. a) Find the mean BMI for men aged 25–34. b) Find the standard deviation of BMI for men aged 25–34. c) Find the median BMI for men aged 25–34. d) What proportion of men aged 25–34 have a BMI less than 22? e) Find the 75th percentile of BMI for men aged 25–34.arrow_forwardAn experiment to compare the tension bond strength of polymer latex modified mortar (Portland cement mortar to which polymer latex emulsións have been added during mixing) to that of unmodified mortar resulted in x = 18.11 kgf/cm2 for the modified mortar (m = 42) and y = 16.88 kgf/cm2 for the unmodified mortar (n = 31). Let ₁ and ₂ be the true average tension bond strengths for the modified and unmodified mortars, respectively. Assume that the bond strength distributions are both normal. (a) Assuming that o₁ = 1.6 and ₂ = 1.3, test Ho: ₁ - ₂ = 0 versus H₂: H₁ - H₂> 0 at level 0.01. Calculate the test statistic and determine the P-value. (Round your test statistic to two decimal places and your P-value to four decimal places.) Z = P-value = State the conclusion in the problem context. O Fail to reject Ho. The data suggests that the difference in average tension bond strengths exceeds 0. Fail to reject Ho. The data does not suggest that the difference in average tension bond strengths…arrow_forward
 MATLAB: An Introduction with ApplicationsStatisticsISBN:9781119256830Author:Amos GilatPublisher:John Wiley & Sons Inc
 Probability and Statistics for Engineering and th...StatisticsISBN:9781305251809Author:Jay L. DevorePublisher:Cengage Learning
 Statistics for The Behavioral Sciences (MindTap C...StatisticsISBN:9781305504912Author:Frederick J Gravetter, Larry B. WallnauPublisher:Cengage Learning
 Elementary Statistics: Picturing the World (7th E...StatisticsISBN:9780134683416Author:Ron Larson, Betsy FarberPublisher:PEARSON
 The Basic Practice of StatisticsStatisticsISBN:9781319042578Author:David S. Moore, William I. Notz, Michael A. FlignerPublisher:W. H. Freeman
 Introduction to the Practice of StatisticsStatisticsISBN:9781319013387Author:David S. Moore, George P. McCabe, Bruce A. CraigPublisher:W. H. Freeman