
a)
To estimate: The regression equation.
Introduction:
a)
Explanation of Solution
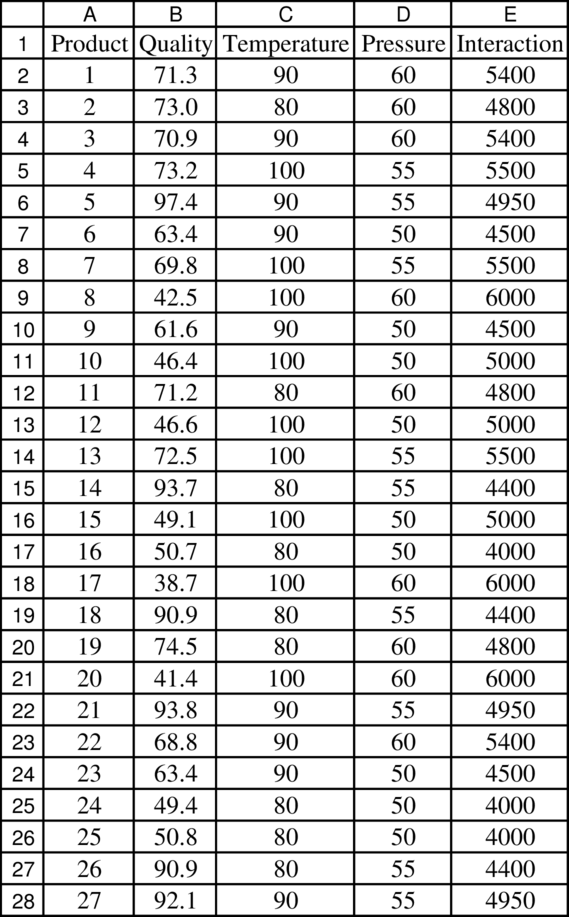
Data:

Formulae to determine the data:

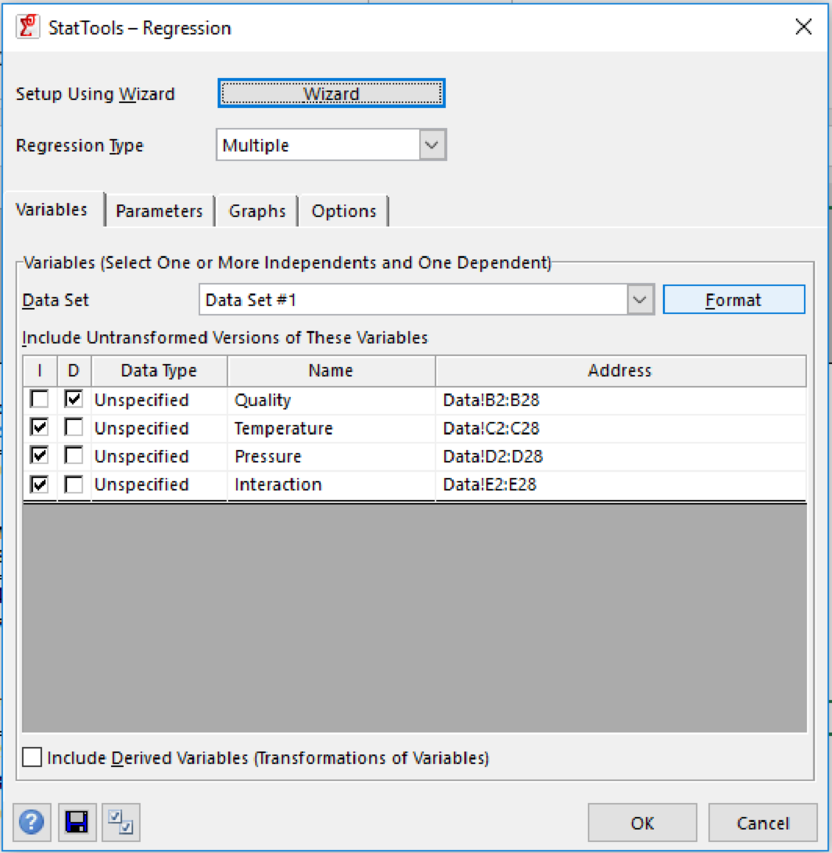
Regression using StatTools:
Regression and classification from the StatTools should be used. The below image shows the regression parameter table from StatTools:
Regression result:
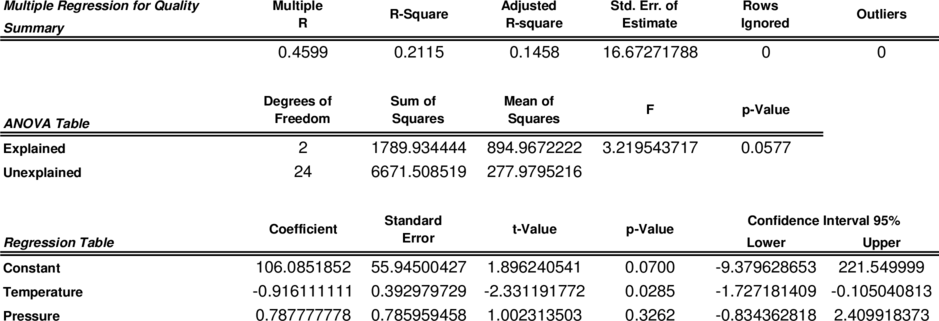
Hence, the regression equation is Quality = 106.085 – 0.916 temperature + 0.788 pressure. The value of R-square is 0.2115. The quality score falls by 0.916 and the pressure would remain constant when the temperature increases by one degree. The quality score rises by 0.788 and the temperature would remain constant when the pressure increases by one pound.
b)
To run: The regression by adding an interaction term between pressure and temperature.
Introduction: Forecasting is a technique of predicting future events based on historical data and projecting them into the future with a mathematical model. Forecasting may be an intuitive or subjective prediction.
b)
Explanation of Solution
Data:
Formulae to determine the data:
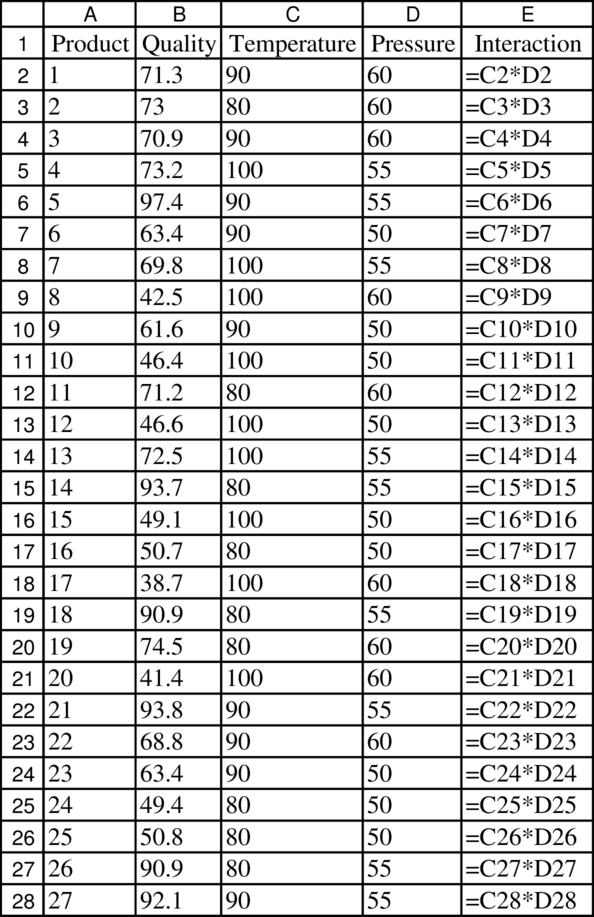
Regression using StatTools:
Regression and classification from the StatTools should be used. The below image shows the regression parameter table from StatTools:

Regression result:
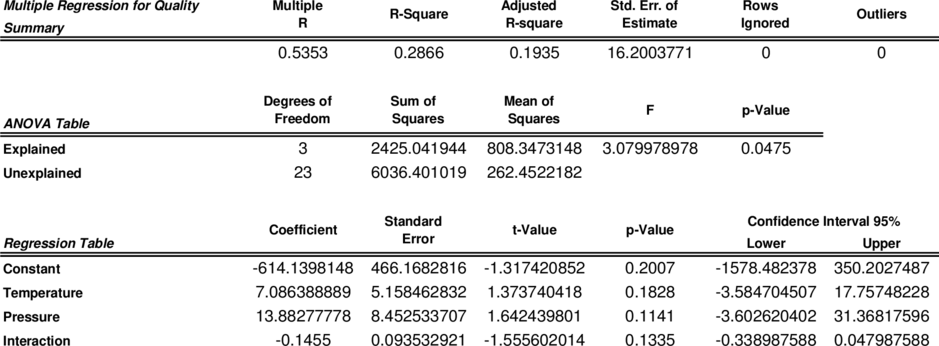
The above table provides the estimated coefficients. The standard error of estimate falls and the adjusted R-square rises.
c)
To determine: The difference between the estimated coefficients in the two equations.
Introduction: Forecasting is a technique of predicting future events based on historical data and projecting them into the future with a mathematical model. Forecasting may be an intuitive or subjective prediction.
c)
Explanation of Solution
The quality score would increase by 7.086 – 0.145×pressure and the pressure would remain constant when the temperature increases by one degree. The quality score would increase by 13.883 – 0.145×temperature and the temperature would remain constant when the pressure increases by one pound per square inch. Based on the level of the pressure, the coefficient would indicate the quality change rate with respect to the temperature.
Want to see more full solutions like this?
Chapter 13 Solutions
Practical Management Science

- The file P02_41.xlsx contains the cumulative number of bits (in trillions) of DRAM (a type of computer memory) produced and the price per bit (in thousandth of a cent). a. Fit a power curve that can be used to show how price per bit drops with increased production. This relationship is known as the learning curve. b. Suppose the cumulative number of bits doubles. Create a prediction for the price per bit. Does the change in the price per bit depend on the current price?arrow_forwardUse the RAND function and the Copy command to generate 100 random numbers. a. What fraction of the random numbers are smaller than 0.5? b. What fraction of the time is a random number less than 0.5 followed by a random number greater than 0.5? c. What fraction of the random numbers are larger than 0.8? d. Freeze these random numbers. However, instead of pasting them over the original random numbers, paste them onto a new range. Then press the F9 recalculate key. The original random numbers should change, but the pasted copy should remain the same.arrow_forwardSuppose you have invested 25% of your portfolio in four different stocks. The mean and standard deviation of the annual return on each stock are shown in the file P11_46.xlsx. The correlations between the annual returns on the four stocks are also shown in this file. a. What is the probability that your portfolios annual return will exceed 30%? b. What is the probability that your portfolio will lose money during the year?arrow_forward
- Select the least accurate statement regarding RISKSIMTABLE. RISKSIMTABLE is a feature that is included in Excel. RISKSIMTABLE is helpful for automating the process of running multiple simulations with different input values. One difference between the RISKSIMTABLE functionality and the data table functionality is that it runs a simulation for each input value and data table does not. O When multiple simulation runs are specified, the RISKSIMTABLE function is used to control in the value of a particular input cell that is used for each simulation. O The RISKSIMTABLE function is inserted into a cell with an input value and points to a range of values that the input value will take on.arrow_forwardA tire factory wants to set a minimum mileage guarantee on its tyre. Tyre tests reveals that the mean mileage has a normal distribution with mean 128 and standard deviation 1.76. the manufacturer wants to set the minimum guaranteed mileage so that no more than 2.5 percent of tyres will have to be replaced. The Lower limit of guaranteed mileage is :? (Write your answer in 2 decimals places)arrow_forwardGiven the following panel data model Y = Bo + B1X + a; + U which of the followings is(are) correct? Yanıtınız: a, refers observable fixed effects while u, refers to unobservable fixed effects. a, and u are both unobservable. We cannot estimate B, if X, is time varying. O We cannot estimate the model if some individuals are dropped from the data.arrow_forward
- A three year old Canadian who moves to the U.S. and becomes a U.S. citizen can be elected president once they reach age 35. True Falsearrow_forwardBad simulations Explain why each of the followingsimulations fails to model the real situation properly:a) Use a random integer from 0 through 9 to representthe number of heads when 9 coins are tossed. b) A basketball player takes a foul shot. Look at a ran-dom digit, using an odd digit to represent a good shot and an even digit to represent a miss.c) Use random numbers from 1 through 13 to represent thedenominations of the cards in a five-card poker hand.arrow_forwardMarkov process models can be used to describe the probability that a consumer purchasing brand A in one time period 1.will sell brand A in the next period 2. all of the answers are correct. 3.will sell brand A after three time periods 4. will not purchase brand A in the next periodarrow_forward
- Company XYZ produces and sells two types of calculators: Basic and Scientific. The Basic has a lower selling price per unit compared to the Scientific. However, the Basic has a higher contribution margin compared to the Scientific. Due to fixed production capacity, the company has a cap on total production ability. If the company's CEO has decided to shift the sales mix towards producing more Basic calculators. What would be the effect on total profits? a. Cannot be determined using the above information b. Total profits would remain the same Total profits would increase O C. d. None of the given answers e. Total profits would decrease OO00arrow_forwardFunctions are used to map elements from one set to another. For example, barcode and QR scanner systems are developed by programmers to use specific symbologies to map the pattern in the barcode to actual digits. The check digit or the final digit is used to determine whether the function is true (known good) or false (errors in the mapping occurred). RFID system developers also use functions to develop a pairing protocol that securely connects legitimate devices within a specific proximity. RFIDs are using in logistics, retail, warehousing, and more.arrow_forwardWhich of the following statements is correct for the Black-Scholes model? A) The price of an American call written on a stock is: c = SN(d1)-Ke-rTN(d2) B) The stock price at a future point in time follows a log-normal distribution. C) The continuously compounded return on the stock follows a log-normal distribution. D) Black-Scholes prices may allow for arbitrage opportunities. Please explain and justify your choice.arrow_forward
 Practical Management ScienceOperations ManagementISBN:9781337406659Author:WINSTON, Wayne L.Publisher:Cengage,