
Managerial Accounting: The Cornerstone of Business Decision-Making
7th Edition
ISBN: 9781337115773
Author: Maryanne M. Mowen, Don R. Hansen, Dan L. Heitger
Publisher: Cengage Learning
expand_more
expand_more
format_list_bulleted
Videos
Textbook Question
Chapter 13, Problem 28BEB
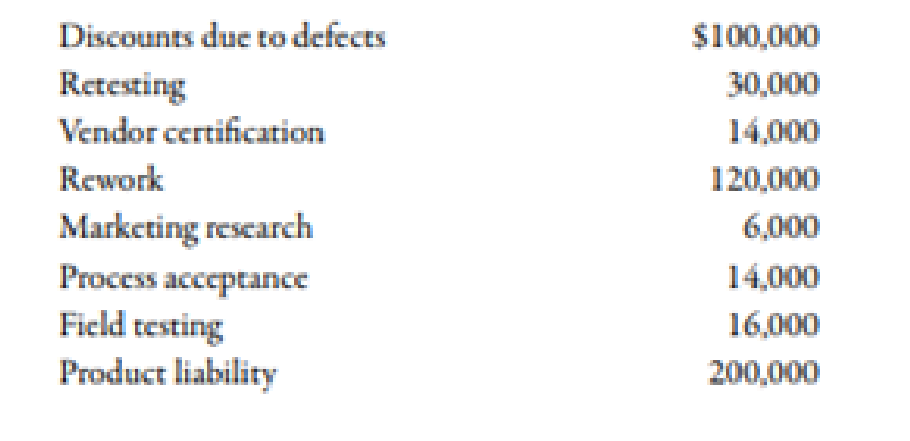
Quality Cost Report
Loring Company had total sales of $2,400,000 for fiscal 20X1. The costs of quality-related activities are given below.
Required:
- 1. Prepare a quality cost report, classifying costs by category and expressing each category as a percentage of sales. What message does the cost report provide?
- 2. Prepare a bar graph and pie chart that illustrate each category’s contribution to total quality costs. Comment on the significance of the distribution.
Expert Solution & Answer
Want to see the full answer?
Check out a sample textbook solution
Students have asked these similar questions
Prepare a cost of quality report. Round the percents of total quality cost to the nearest whole number and the percents of total
sales to one decimal place.
Cost of Quality Report
Percent of Total Quality
Quality Cost Classification
Quality Cost
Percent of Total Sales
Cost
Prevention
Appraisal
Internal failure
External failure
Total
%
1.1.0.0.0
%
%
%
%
%
Fernando Garza's firm wishes to use factor rating to help select an outsourcing provider of logistics services.
a) With weights from 1
-
5 (5 being the highest) and ratings from 1
100 (100 being the highest), use the following table to help Garza make his decision.
In the following table, compute the weighted average score for each of the three companies (enter your responses rounded to one decimal place).
Weight Overnight
Criterion
Quality
Delivery
Cost
(W)
Shipping
Worldwide
Delivery
United
Freight
5
88
80
72
3
71
90
72
2
71
85
97
Weighted average score:
79.5
84
77
The best outsource provider is Worldwide Delivery
b) Garza decides to increase the weights for quality, delivery, and cost to 10, 6, and 4, respectively.
If each weight is doubled, the best outsource provider is Worldwide Delivery .
How does this change your conclusions?
A. The conclusion changes since the weighted averages change.
B. The conclusion does not change but the weighted averages change.
C. The conclusion…
Value chain classifications Match each of the following cost items with the value chain business function where you would expect the cost to be incurred:
Business Function Cost Item Answera. Research and development 1. Purchase of raw materialsb. Design 2. Advertisingc. Production 3. Salary of research scientistsd. Marketing 4. Shipping expensese. Distribution 5. Reengineering of product assembly processf. Customer service 6. Replacement parts for warranty repairs7. Manufacturing supplies8. Sales commissions9. Purchase of CAD (computer-aideddesign) software10. Salary of website designer
Chapter 13 Solutions
Managerial Accounting: The Cornerstone of Business Decision-Making
Ch. 13 - Prob. 1DQCh. 13 - Prob. 2DQCh. 13 - Why should the incremental cost of a risk response...Ch. 13 - Prob. 4DQCh. 13 - Explain how performance measurement can help...Ch. 13 - Identify and discuss the four kinds of quality...Ch. 13 - Discuss the benefits of quality cost reports that...Ch. 13 - Prob. 8DQCh. 13 - Prob. 9DQCh. 13 - When will the average unit cost be used for value...
Ch. 13 - How do international issues affect the role of the...Ch. 13 - What it a foreign trade zone, and what advantages...Ch. 13 - Prob. 13DQCh. 13 - Prob. 14DQCh. 13 - Prob. 15DQCh. 13 - A fire insurance policy on a manufacturing plant...Ch. 13 - Prob. 2MCQCh. 13 - Prob. 3MCQCh. 13 - Which of the following risk response items would...Ch. 13 - Beginning with strategy, which of the following...Ch. 13 - In which areas of an organizations value chain can...Ch. 13 - Prob. 7MCQCh. 13 - Which of the following items (correctly describes...Ch. 13 - Which of the following is a prevention cost? a....Ch. 13 - Prob. 10MCQCh. 13 - Prob. 11MCQCh. 13 - Prob. 12MCQCh. 13 - Prob. 13MCQCh. 13 - A manufacturing cell within a value stream has...Ch. 13 - Prob. 15MCQCh. 13 - Prob. 16MCQCh. 13 - Prob. 17MCQCh. 13 - Prob. 18MCQCh. 13 - Prob. 19MCQCh. 13 - Prob. 20BEACh. 13 - Quality Cost Report Whitley Company had total...Ch. 13 - Andresen Company had the following quality costs...Ch. 13 - Norris Company implemented a quality improvement...Ch. 13 - Mabbut Company has the following departmental...Ch. 13 - During the week of May 10, Hyrum Manufacturing...Ch. 13 - Prob. 26BEACh. 13 - Prob. 27BEBCh. 13 - Quality Cost Report Loring Company had total sales...Ch. 13 - Cassara, Inc., had the following quality costs for...Ch. 13 - Pintura Company implemented a quality improvement...Ch. 13 - Gumbrecht Company has the following departmental...Ch. 13 - During the week of August 21, Parley Manufacturing...Ch. 13 - Prob. 33BEBCh. 13 - Prob. 34ECh. 13 - Prob. 35ECh. 13 - Crazy Fan Guard Company provides security services...Ch. 13 - Jacks Apps Company researches, develops, and sells...Ch. 13 - Prob. 38ECh. 13 - Prob. 39ECh. 13 - Classify the following quality costs as prevention...Ch. 13 - Bradshaw Company reported sales of 5,000,000 in...Ch. 13 - The controller of Emery, Inc. has computed quality...Ch. 13 - Erba Inc. has the following departmental layout...Ch. 13 - A value stream has three activities and two...Ch. 13 - A Box Scorecard was prepared for a value stream:...Ch. 13 - Match each term in Column A with its related...Ch. 13 - Match each term in Column A with its related...Ch. 13 - Prob. 48ECh. 13 - Refer to Exercise 13-48. Suppose that Kamber is...Ch. 13 - Prob. 50ECh. 13 - Prob. 51PCh. 13 - Prob. 52PCh. 13 - Dorsey Scott MU Company manufactures and bottles a...Ch. 13 - Danna Wise, president of Tidwell Company, recently...Ch. 13 - Prob. 55PCh. 13 - In 20X1, Don Blackburn, president of Price...Ch. 13 - Brasher Company is transitioning to a lean...Ch. 13 - Merkley Company, a manufacturer of machine parts,...Ch. 13 - Paladin Company manufactures plain paper fax...Ch. 13 - Custom Shutters. Inc., manufactures plantation...Ch. 13 - Prob. 61PCh. 13 - Corporate sustainability reports vary greatly...Ch. 13 - Luna Company is a printing company and a...Ch. 13 - Lindell Manufacturing embarked on an ambitious...Ch. 13 - Paterson Company, a U.S.-based company,...
Knowledge Booster


Learn more about
Need a deep-dive on the concept behind this application? Look no further. Learn more about this topic, accounting and related others by exploring similar questions and additional content below.Similar questions
- Cost of quality and value-added/non-value-added reports for a service company A. Using the information in Exercise 17, identify the cost of quality classification for each activity and whether the activity is value-added or non-value-added. B. Prepare a cost of quality report. Assume that sales are 3,000,000. (Round percentages to one decimal place.) C. Prepare a value-added/non-value-added analysis. D. Interpret the information in (B) and (C).arrow_forwardCost of quality report A. Using the information in Exercise 15, identify the cost of quality classification for each activity. B. Prepare a cost of quality report. Assume sales for the period were 4,000,000. Round percentages to one decimal place. C. Interpret the cost of quality report.arrow_forwardThe following list gives a number of measures associated with the Balanced Scorecard:a. Number of new customersb. Percentage of customer complaints resolved with one contactc. Unit product costd. Cost per distribution channele. Suggestions per employeef. Warranty repair costsg. Consumer satisfaction (from surveys)h. Cycle time for solving a customer problemi. Strategic job coverage ratioj. On-time delivery percentagek. Percentage of revenues from new productsRequired:1. Classify each performance measure as belonging to one of the following perspectives:financial, customer, internal business process, or learning and growth.2. Suggest an additional measure for each of the four perspectives.arrow_forward
- Hi-Tek Manufacturing, Incorporated, makes two industrial component parts-B300 and T500. An absorption costing income statement for the most recent period is shown below: Hi-Tek Manufacturing, Incorporated Income Statement Sales Cost of goods sold Gross margin Selling and administrative expenses Net operating loss Hi-Tek produced and sold 60,400 units of B300 at a price of $21 per unit and 12,800 units of T500 at a price of $39 per unit. The company's traditional cost system allocates manufacturing overhead to products using a plantwide overhead rate and direct labor dollars as the allocation base. Additional information relating to the company's two product lines is shown below: Direct materials Direct labor Manufacturing overhead Cost of goods sold $ 1,767,600 1,212,922 554,678 610,000 $ (55,322) 8300 T500 $ 400,300 $ 162,400 $ 120,100. $ 42,400 Activity Cost Pool (and Activity Measure) Machining (machine-hours) Setups (setup hours) Product-sustaining (number of products) Other…arrow_forwardMatch the terms a through d with their correct definition 1 through 4. a. Standard cost card b. Management by exception c. Standard cost d. Ideal standard 1. Quantity of input required if a production process is 100% efficient. 2. Managing by focusing on large differences from standard costs. 3. Record that accumulates standard cost information. 4. Preset cost for delivering a product or service under normal conditions.arrow_forwardValue chain classifications Match each of the following cost items with the value chain business function where you would expect the cost to be incurred: Business Function Cost Item Answera. Research and development 1. Labor time to repair products under warrantyb. Design 2. TV commercial spotsc. Production 3. Labor costs of fi lling customer ordersd. Marketing 4. Testing of competitor’s producte. Distribution 5. Direct manufacturing labor costsf. Customer service 6. Development of order tracking system forthe Internet7. Printing cost of new product brochures8. Hours spent designing childproof bottles9. Training costs for representatives to staff the customer call center10. Installation of robotics equipment in manufacturing plantarrow_forward
- Ross Company implemented a quality improvement program and tracked the following for the five years: By cost category as a percentage of sales for the same period of time: Required: 1. Prepare a bar graph that reveals the trend in quality cost as a percentage of sales (time on the horizontal axis and percentages on the vertical). Comment on the message of the graph. 2. Prepare a bar graph for each cost category as a percentage of sales. What does this graph tell you? 3. What if management would like to have the trend in relative distribution of quality costs? Express this as a bar graph and comment on its significance.arrow_forwardCicleta Manufacturing has four activities: receiving materials, assembly, expediting products, and storing goods. Receiving and assembly are necessary activities; expediting and storing goods are unnecessary. The following data pertain to the four activities for the year ending 20x1 (actual price per unit of the activity driver is assumed to be equal to the standard price): Required: 1. Prepare a cost report for the year ending 20x1 that shows value-added costs, non-value-added costs, and total costs for each activity. 2. Explain why expediting products and storing goods are non-value-added activities. 3. What if receiving cost is a step-fixed cost with each step being 1,500 orders whereas assembly cost is a variable cost? What is the implication for reducing the cost of waste for each activity?arrow_forwardSanford, Inc., has developed value-added standards for four activities: purchasing parts, receiving parts, moving parts, and setting up equipment. The activities, the activity drivers, the standard and actual quantities, and the price standards for 20x1 are as follows: The actual prices paid per unit of each activity driver were equal to the standard prices. Required: 1. Prepare a cost report that lists the value-added, non-value-added, and actual costs for each activity. 2. Which activities are non-value-added? Explain why. Also, explain why value-added activities can have non-value-added costs.arrow_forward
- Classify each of the following performance measures into the balanced scorecard perspective to which it relates: financial perspective, internal operations perspective, learning and growth perspective, or customer perspective. A. Employee satisfaction surveys B. Units of waste per production process, uniformity of products and inventory control C. Number of energy-efficient bulbs replaced D. Management training course certificates awarded E. Divisional profit F. Number of customer referralsarrow_forwardPintura Company implemented a quality improvement program and tracked the following for the five years: By cost category as a percentage of sales for the same period of time: Required: 1. Prepare a bar graph that reveals the trend in quality cost as a percentage of sales (time on the horizontal axis and percentages on the vertical). Comment on the message of the graph. 2. Prepare a bar graph for each cost category as a percentage of sales. What does this graph tell you?arrow_forwardMethod of Least Squares, Predicting Cost for Different Time Periods from the One Used to Develop a Cost Formula Refer to the information for Farnsworth Company on the previous page. However, assume that Tracy has used the method of least squares on the receiving data and has gotten the following results: Required: 1. Using the results from the method of least squares, prepare a cost formula for the receiving activity. 2. Using the formula from Requirement 1, what is the predicted cost of receiving for a month in which 1,450 receiving orders are processed? (Note: Round your answer to the nearest dollar.) 3. Prepare a cost formula for the receiving activity for a quarter. Based on this formula, what is the predicted cost of receiving for a quarter in which 4,650 receiving orders are anticipated? Prepare a cost formula for the receiving activity for a year. Based on this formula, what is the predicted cost of receiving for a year in which 18,000 receiving orders are anticipated?arrow_forward
arrow_back_ios
SEE MORE QUESTIONS
arrow_forward_ios
Recommended textbooks for you
 Managerial Accounting: The Cornerstone of Busines...AccountingISBN:9781337115773Author:Maryanne M. Mowen, Don R. Hansen, Dan L. HeitgerPublisher:Cengage Learning
 Cornerstones of Cost Management (Cornerstones Ser...AccountingISBN:9781305970663Author:Don R. Hansen, Maryanne M. MowenPublisher:Cengage Learning
 Financial And Managerial AccountingAccountingISBN:9781337902663Author:WARREN, Carl S.Publisher:Cengage Learning,
 Managerial AccountingAccountingISBN:9781337912020Author:Carl Warren, Ph.d. Cma William B. TaylerPublisher:South-Western College Pub
 Principles of Cost AccountingAccountingISBN:9781305087408Author:Edward J. Vanderbeck, Maria R. MitchellPublisher:Cengage Learning
 Principles of Accounting Volume 2AccountingISBN:9781947172609Author:OpenStaxPublisher:OpenStax College
Managerial Accounting: The Cornerstone of Busines...
Accounting
ISBN:9781337115773
Author:Maryanne M. Mowen, Don R. Hansen, Dan L. Heitger
Publisher:Cengage Learning
Cornerstones of Cost Management (Cornerstones Ser...
Accounting
ISBN:9781305970663
Author:Don R. Hansen, Maryanne M. Mowen
Publisher:Cengage Learning
Financial And Managerial Accounting
Accounting
ISBN:9781337902663
Author:WARREN, Carl S.
Publisher:Cengage Learning,
Managerial Accounting
Accounting
ISBN:9781337912020
Author:Carl Warren, Ph.d. Cma William B. Tayler
Publisher:South-Western College Pub
Principles of Cost Accounting
Accounting
ISBN:9781305087408
Author:Edward J. Vanderbeck, Maria R. Mitchell
Publisher:Cengage Learning
Principles of Accounting Volume 2
Accounting
ISBN:9781947172609
Author:OpenStax
Publisher:OpenStax College
Inspection and Quality control in Manufacturing. What is quality inspection?; Author: Educationleaves;https://www.youtube.com/watch?v=Ey4MqC7Kp7g;License: Standard youtube license