
a)
To analyze the equilibrium level of wage rate and number of labors employed.
a)
Explanation of Solution
Given:
Supply of labor:
At equilibrium,
Substituting the value of w in supply equation we get,
Thus, at equilibrium
b)
To analyze the amount of subsidy and the new equilibrium level of employment after subsidy.
b)
Explanation of Solution
New equilibrium wage that government wishes to rise is $4.
Hence,
Now,
To compute new equilibrium wage,
At new equilibrium,
Hence,
Similarly,
c)
To analyze the number of labors demanded at the wage $4 and
c)
Explanation of Solution
Given:
To compute the number of labors demanded at $4 we will substitute the value of w as $4 in demand equation,
Similarly, the number of labors supplied at wage $4 can be computed by substituting the value of $4 in supply equation,
At wage rate of $4, 250 labors are demanded, and 400 labors are available. Therefore, unemployment can be computed as:
d)
To draw the graph of the above situations.
d)
Explanation of Solution
When the government gives subsidy, the demand curve for the labor will shift to the right because the firms will be more willing to hire labors. The diagram below shows the effect of subsidy on the demand curve for labor.
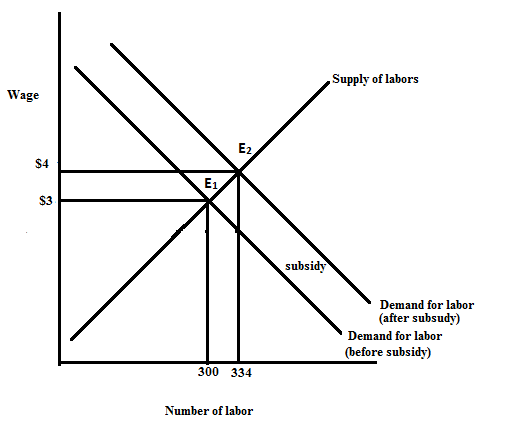
In the diagram initial equilibrium is at point E1 where, the wage rate is $3 and number of labors employed is 300. When the government gives subsidy, the demand for labor shifts to the right due to which the equilibrium shifts to E2 and the number of labors employed rises to 334.
Want to see more full solutions like this?
Chapter 13 Solutions
EBK INTERMEDIATE MICROECONOMICS AND ITS

- Walmart employs the majority of people in small rural town. It's demand for labor is given by QD=100-2P. The supply of labor is given by Qs=3P. ✓ people would be If the labor market functioned as a competitive market, the wage rate (the price of labor) would be employed, and the producer surplus would be Because Walmart faces little competition for workers, it decides to offer the wage that maximizes consumer surplus (the monopsonist price). This wage is ✓being employed. The producer surplus is now ✓. Note: don't worry if the number of ✓, which results in workers is not an integer.arrow_forwardThe following graph shows the labor market for research assistants in the fictional country of Collegia. The equilibrium wage is $10 per hour, and the equilibrium number of research assistants is 200. Suppose the government has decided to institute a $4-per-hour payroll tax on research assistants and is trying to determine whether the tax should be levied on the employer, the workers, or both (such that half the tax is collected from each side). Use the graph input tool to evaluate these three proposals. Entering a number into the Tax Levied on Employers field (initially set at zero dollars per hour) shifts the demand curve down by the amount you enter, and entering a number into the Tax Levied on Workers field (initially set at zero dollars per hour) shifts the supply curve up by the amount you enter. To determine the before-tax wage for each tax proposal, adjust the amount in the Wage field until the quantity of labor supplied equals the quantity of labor demanded. You will not be…arrow_forwardGraph Input Tool (? Market for Labor in the Fast Food Industry 20 I Wage (Dollars per hour) 18 6. 16 Labor Demanded (Thousands of workers) Labor Supplied (Thousands of workers) Supply 232 14 12 10 Demand 4 40 80 120 160 200 240 280 320 360 400 LABOR (Thousands of workers) WAGE (Dollars per hour)arrow_forward
- Q5 - Q9 are related to the labour market in Australia. The following graph represents this labour market, where the vertical axis is the wage per hour and the horizontal axis is the number of workers employed (in millions). P Supply 30 25 19.84 Demand 8 12 15 The current minimum wage in Australia is $19.84 per hour. This minimum wage is a [ Select ] price floor. Under this minimum wage, the market wage rate is equal to [ Select ] per-hour and the number of workers employed is equal to [ Select ] million.arrow_forwardIn this market, the equilibrium hourly wage is S and the equilibrium quantity of labor is thousand workers. Suppose a senator introduces a bill to legislate a minimum hourly wage of $6. This type of price control is called a For each of the wages listed in the following table, determine the quantity of labor demanded, the quantity of labor supplied, and the direction of pressure exerted on wages in the absence of any price controls. Wage Labor Demanded Labor Supplied (Dollars per hour) (Thousands of workers) (Thousands of workers) Pressure on Wages 12 True or False: A minimum wage below $10 per hour is not a binding minimum wage in this market. True O Falsearrow_forwardThe market equilibrium wage is currently $12 per hour among hairdressers. At that wage, 17,323 hairdressers are currently employed in the state. The state legislature then sets a minimum wage of $11.50 per hour for hairdressers. If there are no changes to either the demand or supply for hairdressers when that minimum wage is imposed, the number of hairdressers employed in the state will be: a. Fewer than 17,323. b. Still 17,323. c. More than 17,323. d. This is a bilateral monopsony so you can’t tell.arrow_forward
- The following graph shows the labor market for research assistants in the fictional country of Universalia. The equilibrium wage is $10 per hour, and the equilibrium number of research assistants is 250. Suppose the government has decided to institute a $4-per-hour payroll tax on research assistants and is trying to determine whether the tax should be levied on the employer, the workers, or both (such that half the tax is collected from each side). Use the graph input tool to evaluate these three proposals. Entering a number into the Tax Levied on Employers field (initially set at zero dollars per hour) shifts the demand curve down by the amount you enter, and entering a number into the Tax Levied on Workers field (initially set at zero dollars per hour) shifts the supply curve up by the amount you enter. To determine the before-tax wage for each tax proposal, adjust the amount in the Wage field until the quantity of labor supplied equals the quantity of labor demanded. You will not be…arrow_forwardQuestion Two A coal-mining company is the only employer in town, and faces this supply curve for labor: W = 48 + ( 72/2000 )L where w is the daily wage, in dollars, and L is the number of workers employed. The company faces this demand curve for coal: P = 60 − ( 9/ 4000 )Q where p is the price of coal, per ton, and Q is the number of tons sold per day. Coalminers produce 8 tons of coal each, per day, regardless of the number hired. The mining company maximizes profit. a) How many workers will be hired, and how much profit will be made? b) Suppose a union is formed, which sets a wage of $120 per day. At this wage, according to the supply curve given above, 2000 miners are willing to work, and the company is free to hire as many of these as it wants. How many will be hired, and how much profit will be made?arrow_forwardSuppose the demand for skilled military personnel is given by the curve: L= 200-5W, where L is the labor demanded per day in thousands and w is the wage rate. Suppose the supply curve for skilled military personnel is given by L=5W. a. What is the equilibrium wage rate ($) and equilibrium for skilled military personnel (equilibrium quantity of labor)? b. Now suppose due to economic problems that the government imposes a wage ceiling of $16.00 on all skilled military personnel. How many skilled military personnel are demanded and how many are supplied?arrow_forward
- Consider a Kenyan labor market with the following demand and supply functions respectively: QD = 200 – W AND and QS = 120 + W; 4- in; where QD is quantity of labour demanded; QD is quantity of labor supplied and w• is the wage rate is USD in the market.Calculate the market equilibriumarrow_forward9. Minimum wage legislation The following graph shows the labor market in the fast-food industry in the fictional town of Supersize City. Use the graph input tool to help you answer the following questions. You will not be graded on any changes you make to this graph. Note: Once you enter a value in a white field, the graph and any corresponding amounts in each grey field will change accordingly. Graph Input Tool ?) 20 Market for Labor in the Fast Food Industry 18 I Wage (Dollars per hour) 16 Labor Supplied (Thousands of workers) Supply Labor Demanded 900 14 (Thousands of workers) 12 10 8 Demand 4. 0. 90 180 270 360 450 540 630 720 810 900 LABOR (Thousands of workers) WAGE (Dollars per hour)arrow_forwardto finance a new health insurance program, the government of Millonia imposes a new $2-per-hour payroll tax to be paid by employers. What do you expect to happen to wages and the size of the workforce? Explain How will this answer change in markets where labor is inelastically demanded? Explainarrow_forward

