
Concept explainers
Videos
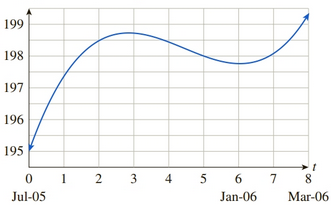
Inflation The following graph shows the approximate value of the U.S. Consumer Price Index (CPI) from July 2005 through March 2006:
CPI July 2005-Mar 2006
 ’
’
The approximating curve shown on the figure is given by
where t is time in months since the start of July 2005.
a. Use the model to estimate the monthly inflation rate in December 2005 and February
b. Was inflation slowing or speeding up in February 2006?
c. When was inflation speeding up? When was inflation slowing? [HINT: See Example 3.]
Want to see the full answer?
Check out a sample textbook solution
Chapter 12 Solutions
Finite Mathematics and Applied Calculus (MindTap Course List)


- The US. import of wine (in hectoliters) for several years is given in Table 5. Determine whether the trend appearslinear. Ifso, and assuming the trend continues, in what year will imports exceed 12,000 hectoliters?arrow_forwardUse the table of values you made in part 4 of the example to find the limiting value of the average rate of change in velocity.arrow_forwardTable 6 shows the year and the number ofpeople unemployed in a particular city for several years. Determine whether the trend appears linear. If so, and assuming the trend continues, in what year will the number of unemployed reach 5 people?arrow_forward
- Table 6 shows the population, in thousands, of harbor seals in the Wadden Sea over the years 1997 to 2012. a. Let x represent time in years starting with x=0 for the year 1997. Let y represent the number of seals in thousands. Use logistic regression to fit a model to these data. b. Use the model to predict the seal population for the year 2020. c. To the nearest whole number, what is the limiting value of this model?arrow_forwardThe half-life of plutonium-244 is 80,000,000 years. Find function gives the amount of carbon-14 remaining as a function of time, measured in years.arrow_forwardFarms in the United States The graph gives the number of farms in the United States from 1850 to 2000. aEstimate the average rate of change in the number of farms between i 1860 and 1890 and ii 1950 and 1970. bIn which decade did the number of farms experience the greatest average rate of decline?arrow_forward
 College AlgebraAlgebraISBN:9781305115545Author:James Stewart, Lothar Redlin, Saleem WatsonPublisher:Cengage Learning
 Algebra & Trigonometry with Analytic GeometryAlgebraISBN:9781133382119Author:SwokowskiPublisher:Cengage
 Algebra and Trigonometry (MindTap Course List)AlgebraISBN:9781305071742Author:James Stewart, Lothar Redlin, Saleem WatsonPublisher:Cengage Learning
 Calculus For The Life SciencesCalculusISBN:9780321964038Author:GREENWELL, Raymond N., RITCHEY, Nathan P., Lial, Margaret L.Publisher:Pearson Addison Wesley,
 Big Ideas Math A Bridge To Success Algebra 1: Stu...AlgebraISBN:9781680331141Author:HOUGHTON MIFFLIN HARCOURTPublisher:Houghton Mifflin Harcourt