
Videos
The article “Fatigue Limits of Enamel Bonds with Moist and Dry Techniques” (Dental Materials, 2009:1527–1531) described an experiment to investigate the ability of adhesive systems to bond to mineralized tooth structures. The response variable is shear bond strength (MPa), and two different adhesives (Adper Single Bond Plus and OptiBond Solo Plus) were used in combination with two different surface conditions. The accompanying data was supplied by the authors of the article. The first 12observations came from the SBP-dry treatment, the next12 from the SBP-moist treatment, the next 12 from the OBP-dry treatment, and the last 12 from the OBP-moist treatment.
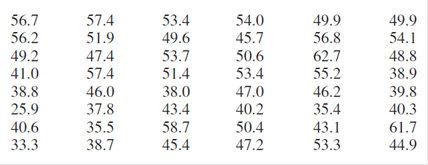
a. Construct a comparative boxplot of the data on the four different treatments and comment.
b. Carry out an appropriate analysis of variance and state your conclusions (use a significance level of .01for any tests). Include any graphs that provide insight.
c. If a significance level of .05 is used for the two-way ANOVA, the interaction effect is significant (just as in general different glues work better with some materials than with others). So now it makes sense to carry out a one-way ANOVA on the four treatments SBP-D, SBP-M, OBP-D, and OBP-M. Do this, and identify significant differences among the treatments.
Want to see the full answer?
Check out a sample textbook solution
Chapter 11 Solutions
Probability and Statistics for Engineering and the Sciences


- In the article “Groundwater Electromagnetic Imaging in Complex Geological and Topographical Regions: A Case Study of a Tectonic Boundary in the French Alps” (S. Houtot, P. Tarits, et al., Geophysics, 2002:1048–1060), the pH was measured for several water samples in various locations near Gittaz Lake in the French Alps. The results for 11 locations on the northern side of the lake and for 6 locations on the southern side are as follows: Northern side: 8.1 8.2 8.1 8.2 8.2 7.4 7.3 7.4 8.1 8.1 7.9 Southern side: 7.8 8.2 7.9 7.9 8.1 8.1 Find a 98% confidence interval for the difference in pH between the northern and southern side.arrow_forwardStructural engineers use wireless sensor networks to monitor the condition of dams and bridges. The article "Statistical Analysis of Vibration Modes of a Suspension Bridge Using Spatially Dense Wireless Sensor Network" (S. Pakzad and G. Fenves, Journal of Structural Engineering, 2009:863-872) desaribes an experiment in which accelerometers were placed on the Golden Gate Bridge for the purpose of estimating vibration modes. For 18 vertical modes, the system was underdamped (damping ratio 1)? Explain why or why not f. e. For what damping ratio would you predict a frequency of 2.0?arrow_forwardThe article "Effect of Granular Subbase Thickness on Airfield Pavement Structural Response" (K. Gopalakrishnan and M. Thompson, Journal of Materials in Civil Engineering, 2008:331-342) presents a study of the amount of surface deflection caused by aircraft landing on an airport runway. A load of 160 kN was applied to a runway surface, and the amount of deflection in mm (y) was measured at various distances in m (x) from the point of application. The results are presented in the following table. y 0.000 3.24 0.305 2.36 0.610 1.42 0.914 0.87 1.219 0.54 1.524 0.34 1.830 0.24 a. Fit the linear model y = Bo + B1x + ɛ. For each coefficient, test the hypothesis that the coefficient is equal to 0. b. Fit the quadratic model y = Bo + Bịx + B2x² + ɛ. For each coefficient, test the hypothesis that the coefficient is equal to 0. %3D Fit the cubic model y = Bo + B1x + B2x? + B3x + E. For each coefficient, test the C. hypothesis that the coefficient is equal to 0. d. Which of the models in parts (a)…arrow_forward
- Recently there has been increased use of stainless steel claddings in industrial settings. Claddings are used to finish the exterior walls of a building and help weatherproof the structure. To ensure the quality of claddings, it is essential to know how welding parameters impact the cladding process. The authors of “Mathematical Modeling of Weld Bead Geometry, Quality, and Productivity for Stainless Steel Claddings Deposited by FCAW” (J. Mater. Engr. Perform., 2012: 1862–1872) in vestigated how y 5 deposition rate was influenced by x1 = feed rate (Wf , in m/min) and x2 = welding speed (S, in cm/min). The following 22 observations correspond to the experiment condition where applied voltage was less than 30v: y: 2.718 3.881 2.773 3.924 2.740 3.870 x1 : 17.0 10.0 7.0 10.0 7.0 10.0 x 2 : 30 30 50 50 30 30 y: 2.847 3.901 2.204 4.454 3.324 3.319 x1 : 7.0 10.0 5.5 11.5 8.5 8.5 x2 : 50 50 40 40 40 20 The whole data and Question parts are attachedarrow_forwardThe article “Effect of Granular Subbase Thickness on Airfield Pavement Structural Response” (K. Gopalakrishnan and M. Thompson, Journal of Materials in Civil Engineering, 2008:331–342) presents a study of the effect of the subbase thickness on the amount of surface deflection caused by aircraft landing on an airport runway. In six applications of a 160 kN load on a runway with a subbase thickness of 864 mm, the average surface deflection was 2.03 mm with a standard deviation of 0.090 mm. Find a 90% confidence interval for the mean deflection caused by a 160 kN load.arrow_forwardThe article “Approximate Methods for Estimating Hysteretic Energy Demand on PlanAsymmetric Buildings” (M. Rathhore, A. Chowdhury, and S. Ghosh, Journal of Earthquake Engineering, 2011: 99–123) presents a method, based on a modal pushover analysis, of estimating the hysteretic energy demand placed on a structure by an earthquake. A sample of 18 measurements had a mean error of 457.8 kNm with a standard deviation of 317.7 kNm. An engineer claims that the method is unbiased, in other words, that the mean error is 0. Can you conclude that this claim is false?arrow_forward
- The article "Effect of Granular Subbase Thickness on Airfield Pavement Structural Response" (K. Gopalakrishnan and M. Thompson, Journal of Materials in Civil Engineering, 2008:331-342) presents a study of the effect of the subbase thickness (in mm) on the amount of surface deflection caused by aircraft landing on an airport runway. Two landing gears, one simulating a Boeing 747 aircraft, and the other a Boeing 777 aircraft, were trafficked across four test sections of runway. The results are presented in the following table. Section 3 4 Boeing 747 Boeing 777 4.01 3.87 3.72 3.76 4.57 4.48 4.36 4.43 Can you conclude that the mean deflection is greater for the Boeing 777?arrow_forwardArtificial joints consist of a ceramic ball mounted on a taper. The article "Friction in Orthopaedic Zirconia Taper Assemblies" (W. Macdonald, A. Áspenberg, et al., Proceedings of the Institution of Mechanical Engineers, 2000: 685-692) presents data on the coefficient of friction for a push-on load of 2 kN for taper assemblies made from two zirconium alloys and employing three different neck lengths. Five measurements were made for each combination of material and neck length. The results presented in the following table are consistent with the cell means and standard deviations presented in the article. Тарег Material Neck Length Coefficient of Friction CPTI-ZIO2 CPTI-Z:O, CPTI-Z:O, Long TIAlloy-ZrO, Short TiAlloy-ZrO, Medium TiAlloy-ZrO, Long Short 0.254 0.195 0.281 0.289 0.220 Medium 0.196 0.220 0.185 0.259 0.197 0.329 0.481 0.320 0.296 0.178 0.150 0.118 0.158 0.175 0.131 0.180 0.184 0.154 0.156 0.177 0.178 0.198 0.201 0.199 0.210 Compute the main effects and interactions. Construct…arrow_forwardA study of the properties of metal plate-connected trusses used for roof support yielded the following observations on axial stiffness index (kips/in.) for plate lengths 4, 6, 8, 10, and 12 in: 4: 329.2 409.5 311.0 326.5 316.8 349.8 309.7 6: 425.1 347.2 361.0 404.5 331.0 348.9 381.7 8: 389.4 366.2 351.0 357.1 409.9 367.3 382.0 10: 341.7 452.9 461.4 433.1 410.6 384.2 362.6 12: 414.4 441.8 419.9 410.7 473.4 441.2 465.8 USE SALT Does variation in plate length have any effect on true average axial stiffness? State the relevant hypotheses using analysis of variance. O Ho: M₁ = H₂ = 13 = H4 = 1₂ H₂: all five μ's are unequal O Ho: My H₂ H3 ‡ M4 # M5 H₂: at least two μ's are equal O Ho: My # H₂ H3 # H4 # H5 H₂: all five us are equal = = o Hỏi khi là không = 3 = Mà khô H₂: at least two μ's are unequal Test the relevant hypotheses using analysis of variance with a = 0.01. Display your results in an ANOVA table. (Round your answers to two decimal places.) Sum of Squares Source Treatments Error…arrow_forward
- A study of the properties of metal plate-connected trusses used for roof support yielded the following observations on axial stiffness index (kips/in.) for plate lengths 4, 6, 8, 10, and 12 in: 4: 333.2 409.5 311.0 326.5 316.8 349.8 309.7 6: 433.1 347.2 361.0 404.5 331.0 348.9 381.7 8: 382.4 366.2 351.0 357.1 409.9 367.3 382.0 10: 350.7 452.9 461.4 433.1 410.6 384.2 362.6 12: 413.4 441.8 419.9 410.7 473.4 441.2 465.8 LUSE SALT Does variation in plate length have any effect on true average axial stiffness? State the relevant hypotheses using analysis of variance. O Hoi Hy #fly #Hz" Ha #Hs H: all five μ's are equal O Hoi H₂H₂ = H3 = HaHs H: at least two μ's are unequal O Hoi H₂ = H₂ = H₂ "HaHs H: all five μ's are unequal O Hoi H₂ #4₂ # Hz*H4 *H5 H: at least two μ's are equal Test the relevant hypotheses using analysis of variance with a = 0.01. Display your results in an ANOVA table. (Round your answers to two decimal places.) Degrees of Sum of Mean freedom Squares Squares Error Total…arrow_forwardThe article "Bone Density and Insertion Torque as Predictors of Anterior Cruciate Ligament Graft Fixation Strength"t gave the accompanying data on maximum insertion torque (N• m) and yield load (N), the latter being one measure of graft strength, for 15 different specimens. Torque 1.8 2.2 1.9 1.3 2.1 2.2 1.6 2.1 1.2 1.8 2.6 2.5 2.5 1.7 1.6 Load 491 477 598 361 605 671 466 431 384 422 554 577 642 348 446 (a) Is it plausible that yield load is normally distributed? Yes, there are more than thirty data values. No, a normal probability plot of yield load is not quite linear. Yes, a normal probability plot of yield load is quite quadratic. No, there is not more than thirty data values. Yes, a normal probability plot of yield load is quite linear. (b) Estimate true average yield load by calculating a confidence interval with a confidence level of 95%. (Round your answer to two decimal places.) Interpret the interval. We are 95% confident that the true population average yield load lies below…arrow_forwardThe article "Experimental Measurement of Radiative Heat Transfer in Gas-Solid Suspension Flow System" (G. Han, K. Tuzla, and J. Chen, AIChe Journal, 2002:1910- 1916) discusses the calibration of a radiometer. Several measurements were made on the electromotive force readings of the radiometer (in volts) and the radiation flux (in kilowatts per square meter). The results (read from a graph) are presented in the following table. Heat flux (y) 15 31 51 55 67 89 Signal output (x) 1.08 2.42 4.17 4.46 5.17 6.92 Compute the least-squares line for predicting heat flux from the signal output. If the radiometer reads 3.00 V, predict the heat flux. If the radiometer reads 8.00 V, should the heat flux be predicted? If so, predict it. If not, explain why. C.arrow_forward
 MATLAB: An Introduction with ApplicationsStatisticsISBN:9781119256830Author:Amos GilatPublisher:John Wiley & Sons Inc
 Probability and Statistics for Engineering and th...StatisticsISBN:9781305251809Author:Jay L. DevorePublisher:Cengage Learning
 Statistics for The Behavioral Sciences (MindTap C...StatisticsISBN:9781305504912Author:Frederick J Gravetter, Larry B. WallnauPublisher:Cengage Learning
 Elementary Statistics: Picturing the World (7th E...StatisticsISBN:9780134683416Author:Ron Larson, Betsy FarberPublisher:PEARSON
 The Basic Practice of StatisticsStatisticsISBN:9781319042578Author:David S. Moore, William I. Notz, Michael A. FlignerPublisher:W. H. Freeman
 Introduction to the Practice of StatisticsStatisticsISBN:9781319013387Author:David S. Moore, George P. McCabe, Bruce A. CraigPublisher:W. H. Freeman