
Concept explainers
Videos
(a)
Find the level of significance.
State the null and alternative hypothesis.
(a)
Answer to Problem 11P
The level of significance is 0.01.
Explanation of Solution
Calculation:
From the given information the value of
Hence, the level of significance is 0.01.
The null and alternative hypothesis is,
Null hypothesis:
Alternative hypothesis:
(b)
Identify the sampling distribution to be used.
Find the value of the sample test statistic.
(b)
Answer to Problem 11P
The sampling distribution to be used is
The value of the sample test statistic is 0.
Explanation of Solution
Calculation:
Conditions:
The conditions for using the normal distribution to test a proportion p with proportion of success
The sample statistic has the normal distribution with mean p, and standard deviation
Test statistic:
The z value for the sample test statistic x is,
In the formula n is the total number of plus and minus signs, x is the total number of plus signs divided by n, p is proportion specified in
The sign is obtained by taking the difference of males and females. If the difference is positive then assign ‘+’ to the corresponding data pair. If the difference is negative then assign ‘–’ to the corresponding data pair. If the difference is zero then remove the data pair from the calculation.
The standard normal distribution is used as the sampling distribution for the sign test.
The signs are,
| Region | Male | Female | Difference | Sign of difference |
| 1 | 7.3 | 7.5 | –0.2 | – |
| 2 | 7.5 | 6.4 | 1.1 | + |
| 3 | 7.7 | 6.0 | 1.7 | + |
| 4 | 21.8 | 20.0 | 1.8 | + |
| 5 | 4.2 | 2.6 | 1.6 | + |
| 6 | 12.2 | 5.2 | 7.0 | + |
| 7 | 3.5 | 3.1 | 0.4 | + |
| 8 | 4.2 | 4.9 | –0.7 | – |
| 9 | 8.0 | 12.1 | –4.1 | – |
| 10 | 9.7 | 10.8 | –1.1 | – |
| 11 | 14.1 | 15.6 | –1.5 | – |
| 12 | 3.6 | 6.3 | –2.7 | – |
| 13 | 3.6 | 4.0 | –0.4 | – |
| 14 | 4.0 | 3.9 | 0.1 | + |
| 15 | 5.2 | 9.8 | –4.6 | – |
| 16 | 6.9 | 9.8 | –2.9 | – |
| 17 | 15.6 | 12.0 | 3.6 | + |
| 18 | 6.3 | 3.3 | 3.0 | + |
| 19 | 8.0 | 7.1 | 0.9 | + |
| 20 | 6.5 | 8.2 | –1.7 | – |
There are ten positive signs and totally 20 positive and negative signs are there.
The value of x is,
The value of x is 0.5.
Test statistic:
Substitute x as 0.5, and n as 20 in the test statistic formula
Hence, the z value is 0.
(c)
Find the P-value of the sample test statistic.
(c)
Answer to Problem 11P
The P-value is 1.00.
Explanation of Solution
Calculation:
Step by step procedure to obtain P-value using MINITAB software is given below:
- Choose Graph > Probability Distribution Plot choose View Probability > OK.
- From Distribution, choose ‘Normal’ distribution.
- Click the Shaded Area tab.
- Choose X Value and Both Tail, for the region of the curve to shade.
- Enter the X value as 0.
- Click OK.
Output using MINITAB software is given below:
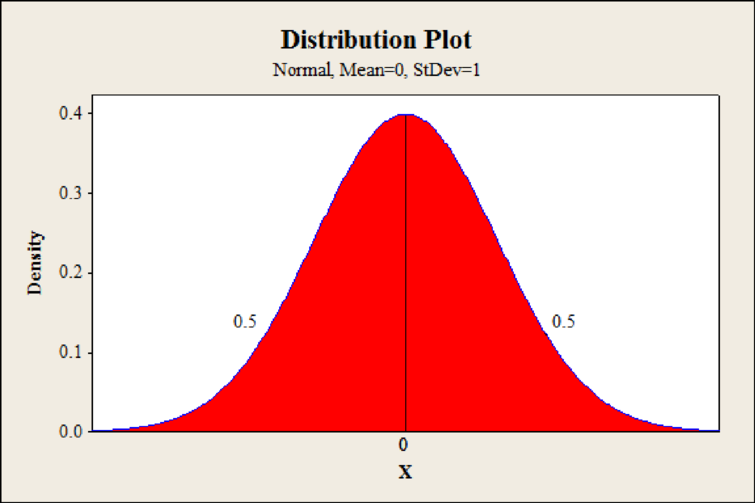
From Minitab output, the P-value is 0.5 which is one sided value.
The two-tailed P-value is,
Hence, the P-value is 1.00.
(d)
Mention the conclusion of the test.
(d)
Answer to Problem 11P
The null hypothesis is failed to be rejected.
Explanation of Solution
Calculation:
From part (c), the P-value is 1.00.
Rejection rule:
- If the P-value is less than or equal to
Conclusion:
The P-value is 1.00 and the level of significance is 0.01.
The P-value is greater than the level of significance.
That is,
By the rejection rule, the null hypothesis is failed to be rejected.
Hence, the data is not statistically significant at level 0.01.
(e)
Interpret the conclusion in the context of the application.
(e)
Explanation of Solution
Calculation:
From part (d), the null hypothesis is failed to be rejected. This shows that, there is no sufficient evidence that the distribution of the dropout rates for males and females are different at level of significance 0.01.
Want to see more full solutions like this?
Chapter 11 Solutions
Understandable Statistics: Concepts and Methods


 Calculus For The Life SciencesCalculusISBN:9780321964038Author:GREENWELL, Raymond N., RITCHEY, Nathan P., Lial, Margaret L.Publisher:Pearson Addison Wesley,
 Big Ideas Math A Bridge To Success Algebra 1: Stu...AlgebraISBN:9781680331141Author:HOUGHTON MIFFLIN HARCOURTPublisher:Houghton Mifflin Harcourt
 Linear Algebra: A Modern IntroductionAlgebraISBN:9781285463247Author:David PoolePublisher:Cengage Learning
 Glencoe Algebra 1, Student Edition, 9780079039897...AlgebraISBN:9780079039897Author:CarterPublisher:McGraw Hill
 Holt Mcdougal Larson Pre-algebra: Student Edition...AlgebraISBN:9780547587776Author:HOLT MCDOUGALPublisher:HOLT MCDOUGAL