
Concept explainers
Videos
Instructions: You may use Excel, MegaStat, Minitab, JMP, or another computer package of your choice. Attach appropriate copies of the output or capture the screens, tables, and relevant graphs and include them in a written report. Try to state your conclusions succinctly in language that would be clear to a decision maker who is a nonstatistician. Exercises marked * are based on optional material. Answer the following questions, or those your instructor assigns.
- a. Choose an appropriate ANOVA model. State the hypotheses to be tested.
- b. Display the data visually (e.g., dot plots or line plots by factor). What do the displays show?
- c. Do the ANOVA calculations using the computer.
- d. State the decision rule for α = .05 and make the decision. Interpret the p-value.
- e. In your judgment, are the observed differences in treatment means (if any) large enough to be of practical importance?
- f. Given the nature of the data, would more data collection be practical?
- g. Perform Tukey multiple comparison tests and discuss the results.
- h. Perform a test for homogeneity of variances. Explain fully.
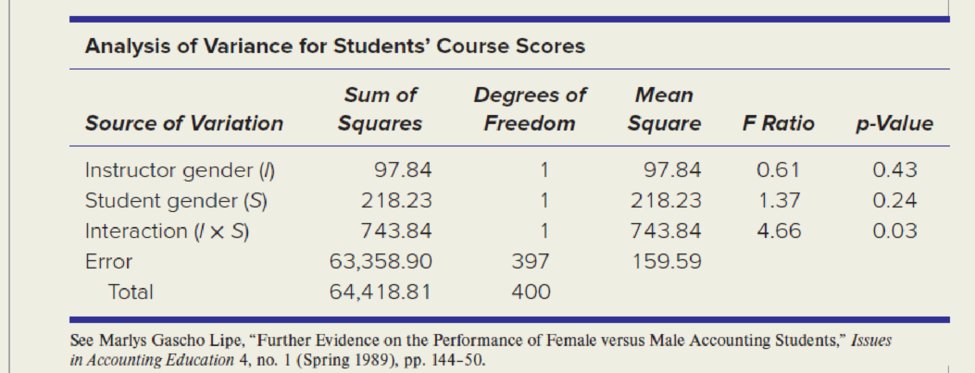
To assess the effects of instructor and student gender on student course scores, an experiment was conducted in 11 sections of managerial accounting classes
Want to see the full answer?
Check out a sample textbook solution
Chapter 11 Solutions
APPLIED STAT.IN BUS.+ECONOMICS
Additional Math Textbook Solutions
Elementary Statistics (13th Edition)
Essentials of Statistics, Books a la Carte Edition (5th Edition)
Elementary Statistics Using Excel (6th Edition)
Business Analytics
Elementary Statistics: A Step By Step Approach
Business Statistics: A First Course (7th Edition)


- State at least one type of conclusion that could be made from the data provided for the KPI. Suggest one other data source that would provide more information to make data-driven decisions. Explain what information that source would supply. (The blue one is mine) or pretty much what can be said of the clustered bar chartarrow_forwardInterpret the table following the suggested guidlines.arrow_forwardQ1. Write aims of data classification ?arrow_forward
- Suppose you need to summarize ordinal data in a bar graph. How would you arrange the categories of data on the horizontal axis? Is it possible to make the order of the data apparent in a pie chart?arrow_forwardDevelop the appropriate control charts (X-chart and R-chart) and determine whether there is any cause for concern in the cutting process. Plot the information and look for patterns.arrow_forward
 Glencoe Algebra 1, Student Edition, 9780079039897...AlgebraISBN:9780079039897Author:CarterPublisher:McGraw Hill
 Elementary Geometry For College Students, 7eGeometryISBN:9781337614085Author:Alexander, Daniel C.; Koeberlein, Geralyn M.Publisher:Cengage,
 Holt Mcdougal Larson Pre-algebra: Student Edition...AlgebraISBN:9780547587776Author:HOLT MCDOUGALPublisher:HOLT MCDOUGAL
 Algebra: Structure And Method, Book 1AlgebraISBN:9780395977224Author:Richard G. Brown, Mary P. Dolciani, Robert H. Sorgenfrey, William L. ColePublisher:McDougal Littell