Videos
a.
To determine: The Expected Return and Standard Deviation for each Security.
Introduction: Expected Return is a process of estimating the
a.
Answer to Problem 35QP
The Expected Return is 12.50%, Variance is 0.002125 and Standard Deviation for Asset 1 is 4.61%. The Expected Return is 12.50%, Variance is 0.002125 and Standard Deviation for Asset 2 is 4.61%. The Expected Return is 12.50%, Variance is 0.002125 and Standard Deviation for Asset 3 is 4.61%.
Explanation of Solution
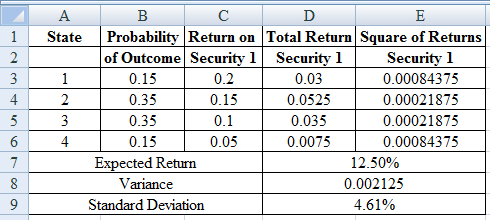
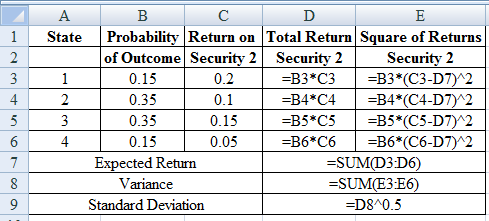
Determine the Expected Return, Variance and Standard Deviation for Asset 1
Using excel spreadsheet we calculate the expected return, variance and standard deviation as,
Excel Spreadsheet:
Excel Workings:
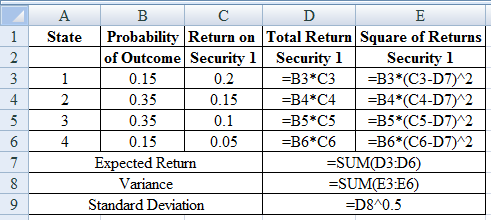
Therefore the Expected Return is 12.50%, Variance is 0.002125 and Standard Deviation for Asset 1 is 4.61%
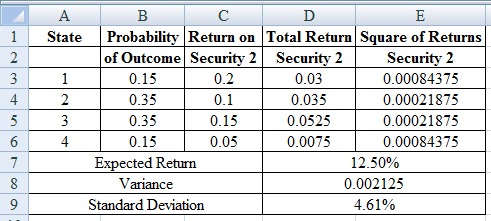
Determine the Expected Return, Variance and Standard Deviation for Asset 2
Using excel spreadsheet we calculate the expected return, variance and standard deviation as,
Excel Spreadsheet:
Excel Workings:
Therefore the Expected Return is 12.50%, Variance is 0.002125 and Standard Deviation for Asset 2 is 4.61%
Determine the Expected Return, Variance and Standard Deviation for Asset 3
Using excel spreadsheet we calculate the expected return, variance and standard deviation as,
Excel Spreadsheet:
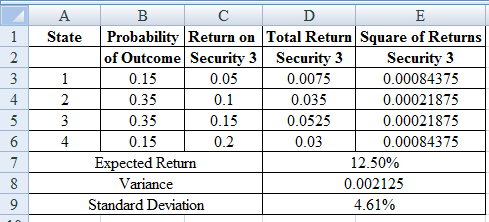
Excel Workings:
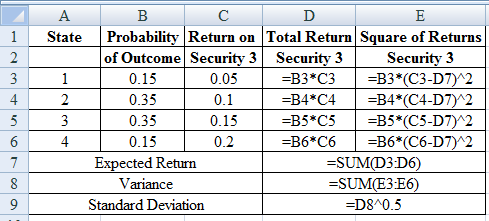
Therefore the Expected Return is 12.50%, Variance is 0.002125 and Standard Deviation for Asset 3 is 4.61%
b.
To determine: The Covariance and Correlation for each pair of security.
b.
Answer to Problem 35QP
Solution: The Covariance is 0.00125 and Correlation is 0.5882 for Security 1 and 2. The Covariance is -0.002125 and Correlation is -1 for Security 1 and 3. The Covariance is -0.00125 and Correlation is -0.5882 for Security 2 and 3.
Explanation of Solution
Determine the Covariance for Security 1 and 2
Using excel we find the covariance and correlation for security 1 and 2 as,
Excel Spreadsheet:
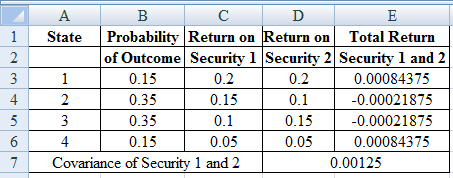
Excel Workings:
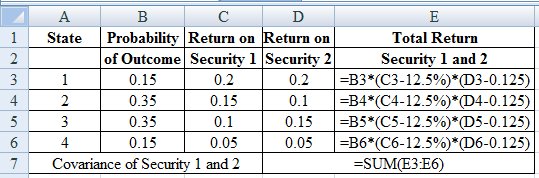
Therefore the Covariance for Security 1 and 2 is 0.00125
Determine the Correlation for Security 1 and 2
Therefore the Correlation for Security 1 and 2 is 0.5882
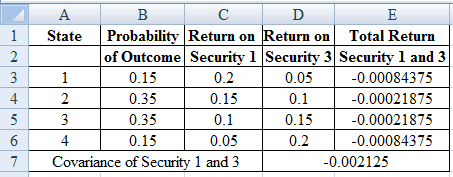
Determine the Covariance for Security 1 and 3
Using excel we find the covariance and correlation for security 1 and 3 as,
Excel Spreadsheet:
Excel Workings:
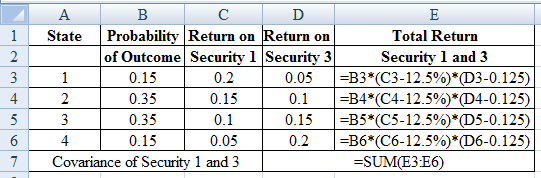
Therefore the Covariance for Security 1 and 3 is -0.00125
Determine the Correlation for Security 1 and 3
Therefore the Correlation for Security 1 and 3 is -1
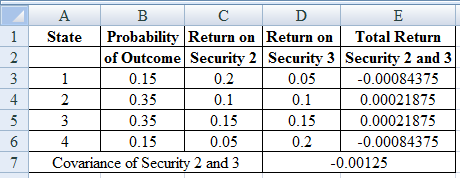
Determine the Covariance for Security 2 and 3
Using excel we find the covariance and correlation for security 2 and 3 as,
Excel Spreadsheet:
Excel Workings:
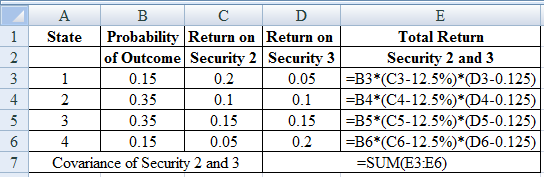
Therefore the Covariance for Security 2 and 3 is -0.00125
Determine the Correlation for Security 2 and 3
Therefore the Correlation for Security 2 and 3 is -0.5882.
c.
To determine: The Expected Return and Standard Deviation of Portfolio of Security 1 and Security 2.
c.
Answer to Problem 35QP
Solution: The Expected Return is 12.50% and Standard Deviation of Portfolio of Security 1 and Security 2 is 4.11%.
Explanation of Solution
Determine the Expected Return on Portfolio of Security 1 and 2
Therefore the Expected Return on Portfolio of Security 1 and 2 is 12.50%
Determine the Variance on Portfolio of Security 1 and 2
Therefore the Variance on Portfolio of Security 1 and 2 is 0.001687
Determine the Standard Deviation on Portfolio of Security 1 and 2
Therefore the Standard Deviation on Portfolio of Security 1 and 2 is 4.11%.
d.
To determine: The Expected Return and Standard Deviation of Portfolio of Security 1 and Security 3.
d.
Answer to Problem 35QP
The Expected Return is 12.50% and Standard Deviation of Portfolio of Security 1 and Security 3 is 0%.
Explanation of Solution
Determine the Expected Return on Portfolio of Security 1 and 3
Therefore the Expected Return on Portfolio of Security 1 and 3 is 12.50%
Determine the Variance on Portfolio of Security 1 and 3
Therefore the Variance on Portfolio of Security 1 and 3 is 0
Determine the Standard Deviation on Portfolio of Security 1 and 3
Therefore the Standard Deviation is 0%.
e.
To determine: The Expected Return and Standard Deviation of Portfolio of Security 2 and Security 3.
e.
Answer to Problem 35QP
The Expected Return is 12.50% and Standard Deviation of Portfolio of Security 2 and Security 3 is 2.09%.
Explanation of Solution
Determine the Expected Return on Portfolio of Security 2 and 3
Therefore the Expected Return on Portfolio of Security 2 and 3 is 12.50%
Determine the Variance on Portfolio of Security 2 and 3
Therefore the Variance on Portfolio of Security 2 and 3 is 0.000438
Determine the Standard Deviation on Portfolio of Security 2 and 3 is 0
Therefore the Standard Deviation is 2.09%.
f.
To determine: The Results of parts (a), (c), (d) and (e).
f.
Explanation of Solution
- The correlation between's the profits on two securities is below 1, there is an advantage to diversification.
- A portfolio that comprise of negatively correlated portfolios can accomplish higher risk diminishment than a positively correlated portfolio and the expected return of the stock being even.
- Applying appropriate weights on perfectly negatively correlated securities can lessen portfolio change to 0.
Want to see more full solutions like this?
Chapter 11 Solutions
Corporate Finance (The Mcgraw-hill/Irwin Series in Finance, Insurance, and Real Estate)


- The market and Stock J have the following probability distributions: a. Calculate the expected rates of return for the market and Stock J. b. Calculate the standard deviations for the market and Stock J.arrow_forwardWhat is a characteristic line? How is this line used to estimate a stocks beta coefficient? Write out and explain the formula that relates total risk, market risk, and diversifiable risk.arrow_forwardThe return, standard deviation, market risk premium and Beta (β) of A, B, C, D and the Market Portfolio and the risk-free interest rate are given in the table below. Find the performance of portfolios (excluding Sortino). portfolio return (rp) risk free interest rate (rf) std. deviation Beta market risk premium (rp- rf) A 18,00 11,00 6,00 1,24 7,00 B 12,00 11,00 2,00 0,87 1,00 C 9,00 11,00 0,50 - 0,73 - 2,00 D 15,00 11,00 3,00 0,46 4,00 Market 13,00 11,00 1,50 1 2,00arrow_forward
- assume that the market consists of two securities. Security A has a market value of $1 billion and a covariance with the market portfolio of 0.15. Security B has a market value of $3 billion and a covariance with the market portfolio of 0.08. What is the standard deviation of the market portfolio?arrow_forwardThe beta of a portfolio is: A. A measure of the correlation of betas of the securities in the portfolio. B. Always greater than one. C. The market value weighted average beta of the securities in the portfolio. D. The geometric average of the beta of the securities in the portfolio.arrow_forwardThe security market line depicts: a. Expected return as a function of systematic risk (indicated by beta) b. The market portfolio as the optimal portfolio of risky assets c. The relationship between a security’s return and the return on the index d. Portfolio combinations of the market portfolio and the risk-free asset e. Expected return as a function of volatilityarrow_forward
- Assume that two securities, A and B, constitute the market portfolio, their proportions and variances are 0.39, 160, and 0.61, 340, respectively. The covariance of the two securities is 190. Estimate the systematic risk (beta) of the two securities. Note that the covariance of security-i with the market portfolio is simply the weighted average of the covariances of security-i with all the securities included in the market portfolio – the lesson you learned in the context of the bordered covariance matrix. Answer step by step.Do all part.Answer must be correct.arrow_forwardQuestion: Assume that using the Security Market Line (SML) the required rate of return (RA) on stock A is found to be half of the required return (RB) on stock B. The risk-free rate (Rf) is one-fourth of the required return on A. Return on market portfolio is denoted by RM. Find the ratio of beta of A to beta of B.arrow_forwardSuppose you have the following expectations about the market condition and the returns on Stocks X and Y. a) What are the expected returns for Stocks X and Y, E(rX) and E(rY)? b) What are the standard deviations of the returns for Stocks X and Y, σX and σY?arrow_forward
- You are given the following information concerning three portfolios, the market portfolio, and the risk-free asset: 8p 1.70 1.30 0.85 1.00 Portfolio X Y Z Market Risk-free Rp 11.5% 10.5 7.2 10.9 4.6 R-squared op 38.00% 33.00 23.00 28.00 0 Assume that the correlation of returns on Portfolio Y to returns on the market is 0.76. What percentage of Portfolio Y's return is driven by the market? Note: Enter your answer as a decimal not a percentage. Round your answer to 4 decimal places.arrow_forwardequals the slope of the security market line: one. beta. the market risk premium. the expected return on the market portfolio.arrow_forwardWhen working with the CAPM, which of the following factors can be determined with the most precision? a. The beta coefficient of "the market," which is the same as the beta of an average stock. b. The beta coefficient, bi, of a relatively safe stock. c. The market risk premium (RPM). d. The most appropriate risk-free rate, rRF. e. The expected rate of return on the market, rM.arrow_forward
 EBK CONTEMPORARY FINANCIAL MANAGEMENTFinanceISBN:9781337514835Author:MOYERPublisher:CENGAGE LEARNING - CONSIGNMENT
 Intermediate Financial Management (MindTap Course...FinanceISBN:9781337395083Author:Eugene F. Brigham, Phillip R. DavesPublisher:Cengage Learning