
To describe: The equilibrium levels of real output and price level.
Answer to Problem 1TY
There exist an inflationary gap
Explanation of Solution
A recessionary gap emerges when aggregate
Graphical representation
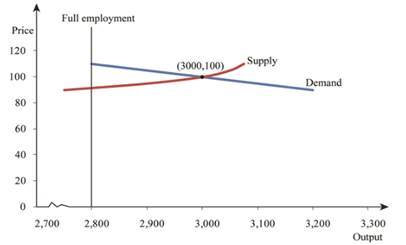
Below figure shows whether the economy has inflationary or recessionary gap.
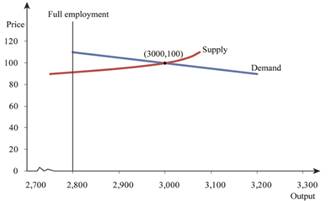
In the above figure, X axis speaks to the various degrees of cost. Here the upward slanting bend is an inventory bend and descending inclining bend is a demand bend.
Figure 2 obviously shows that there exists an inflationary gap when the full work level of yield is $2,800. This is on the grounds that the equilibrium level of yield $3,000 is more prominent than the full work level of yield $2,800.
Introduction: A recessionary gap is a
Want to see more full solutions like this?

- Assume the aggregate demand and aggregate supply curve intersect at a price level of 100. Explain the effect of a shift in the price level to 120 and to 50arrow_forwardIf households decide to save a larger portion of their income, what effect would this have on the output, employment, and price level in the short run? What about the long run?arrow_forwardSuppose the economy produces real GDP of $45 billion when unemployment is at Its natural rate. Use the purple points (diamond symbols) to plot the economy's long-run aggregate supply (LRAS) curve on the graph. PRICE LEVEL 132 128 124 120 116 112 108 104 100 0 10 20 30 40 50 60 70 80 REAL GDP (Billions of dollars) LRAS Help Clear All In the table, determine how each event affects the position of the long-run aggregate supply (LRAS) curve. Note: While economic growth generally shifts the LRAS curve to the right, some circumstances can shift it to the left. Event A scientific breakthrough significantly increases food production per acre of farmland. A government-sponsored training program increases the skill level of the workforce. The government allows more immigration of working-age adults. LRAS Curve Shifts to the... Right Left karrow_forward
- Suppose that the United States is at full employment. Explain the effect of each of the following events on aggregate supply: Union wage settlements push the money wage rate up by 10 percent. The price level increases. Potential GDP increasesarrow_forwardMost economists reason that an economy adjusts to inflationary and recessionary gaps slowly because are fixed in the short run. Consumer preferences Тахes Wages Supplies of most of the inputsarrow_forwardWhat effect would an increase in aggregate demand have on price level and GDP?arrow_forward
- Suppose the people of Canada has reduced their spending on goods and services from the United States. What will be the effect on real GDP and the price level in the short run? In the long run? Show your results graphically.arrow_forwardThe graph shows an economy's aggregate supply and potential GDP. On the graph, draw an aggregate demand curve when the economy is at an above full-employment equilibrium. Label it AD . Draw a point at the above full-employment equilibrium. Draw a horizontal arrow at the equilibrium price level that shows the gap between actual real GDP and potential GDP. >>> Draw only the objects specified in the question.arrow_forwardAssume that the economy is in a full employment equilibrium. There is an increase in consumer sentiment. The following combination of events are likely to occur Select an answer and submit. For keyboard navigation, use the up/down arrow keys to select an answer. a output rises, prices fall b output falls, prices rise. output rises, prices rise d output falls, prices fallarrow_forward


 Economics (MindTap Course List)EconomicsISBN:9781337617383Author:Roger A. ArnoldPublisher:Cengage Learning