
Concept explainers
Videos
Use the model developed in Example 1.5 to predict the total sales for weeks 2 through 16, and compare the results to the observed sales. Does the accuracy of the model seem to be different when coupons are used or not? When advertising is used or not?
EXAMPLE 1.5 A Predictive Sales-Promotion Model
In the grocery industry, managers typically need to know how best to use pricing, coupons, and advertising strategies to influence sales. Grocers often study the relationship of sales volume to these strategies by conducting controlled experiments. That is, they implement different combinations of pricing, coupons, and advertising, observe the sales that result, and use analytics to develop predictive models of sales as a
For example, suppose that a grocer who operates three stores in a small city varied the price, coupons (yes = 1, no = 0), and advertising expenditures in a local newspaper over a 16-week period and observed the following sales:
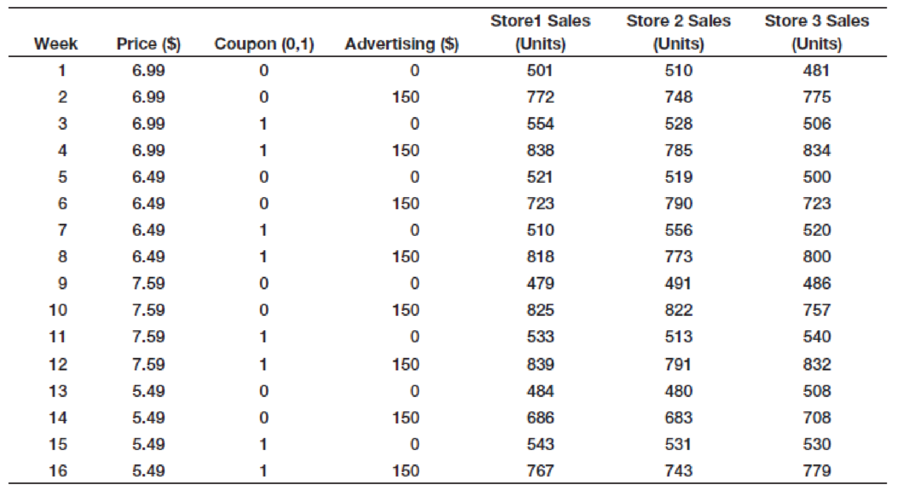
To better understand the relationships among price, coupons, and advertising, an analyst might have developed the following model using business analytics tools (we will see how to do this in Chapter 8):
Total Sales = 1105.55 + 56.18 x Price + 123.88 x Coupon + 5.24 x Advertising (1.4).
Want to see the full answer?
Check out a sample textbook solution
Chapter 1 Solutions
Business Analytics
Additional Math Textbook Solutions
Elementary Statistics (13th Edition)
Statistics: Informed Decisions Using Data (5th Edition)
Basic Business Statistics, Student Value Edition (13th Edition)
An Introduction to Mathematical Statistics and Its Applications (6th Edition)
The Practice of Statistics for AP - 4th Edition
Applied Statistics in Business and Economics


- Using your graphing calculator, make a scatter plot of the data from the table. Then graph your model from Question 2 along with the data. How well does your model fit the data? What could you do to try to improve your model?arrow_forwardUse this data for the exercises that follow: In 2013, there were roughly 317 million citizens in the United States, and about 40 million were elderly (aged 65 and over).[34] 60. It is predicted that by 2030, one in five U.S. citizens will be elderly. How much greater will the chances of meeting an elderly person be at that time? What policy changes do you foresee if these statistics hold true?arrow_forward
 Calculus For The Life SciencesCalculusISBN:9780321964038Author:GREENWELL, Raymond N., RITCHEY, Nathan P., Lial, Margaret L.Publisher:Pearson Addison Wesley,
 Glencoe Algebra 1, Student Edition, 9780079039897...AlgebraISBN:9780079039897Author:CarterPublisher:McGraw Hill
 Trigonometry (MindTap Course List)TrigonometryISBN:9781305652224Author:Charles P. McKeague, Mark D. TurnerPublisher:Cengage Learning
 Big Ideas Math A Bridge To Success Algebra 1: Stu...AlgebraISBN:9781680331141Author:HOUGHTON MIFFLIN HARCOURTPublisher:Houghton Mifflin Harcourt