
Concept explainers
Videos
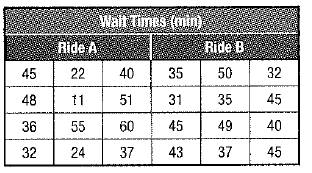
To find: Data is sample or population and then find range, variance and standard deviation.
Answer to Problem 4E
Explanation of Solution
Given information:
Calculation:
It is a sample data because we know exactly it is about two different rides and not all of them.
To find mean, add all observations and divide it by total number of observations.
The mean of ride A is 38.4 and mean of ride B is 40.6
The range is the difference between the highest and lowest value.
The variance is the average square deviation from the mean.
First add all numbers from each set and calculate the square then divide it with the number of integers in set.
Second we take every integer from each set and calculate square of them and add all together.
Third, we subtract integers from second step with ones from first step.
Fourth, take integers from third step and divide them with total number of integers in set of minus one. Which means 12 − 1 = 11.
The standard deviation is the average deviation from the mean. It is found by taking the square root of the variance.
Thus,
Chapter 0 Solutions
Glencoe Algebra 2 Student Edition C2014
Additional Math Textbook Solutions
College Algebra
Linear Algebra and Its Applications (5th Edition)
College Algebra
College Algebra (7th Edition)
Finite Mathematics for Business, Economics, Life Sciences and Social Sciences


 Algebra and Trigonometry (6th Edition)AlgebraISBN:9780134463216Author:Robert F. BlitzerPublisher:PEARSON
 Contemporary Abstract AlgebraAlgebraISBN:9781305657960Author:Joseph GallianPublisher:Cengage Learning
 Linear Algebra: A Modern IntroductionAlgebraISBN:9781285463247Author:David PoolePublisher:Cengage Learning
 Algebra And Trigonometry (11th Edition)AlgebraISBN:9780135163078Author:Michael SullivanPublisher:PEARSON
 Introduction to Linear Algebra, Fifth EditionAlgebraISBN:9780980232776Author:Gilbert StrangPublisher:Wellesley-Cambridge Press
 College Algebra (Collegiate Math)AlgebraISBN:9780077836344Author:Julie Miller, Donna GerkenPublisher:McGraw-Hill Education