
Essentials of Modern Business Statistics with Microsoft Office Excel (Book Only)
7th Edition
ISBN: 9781337298353
Author: David R. Anderson, Dennis J. Sweeney, Thomas A. Williams
Publisher: South-Western College Pub
expand_more
expand_more
format_list_bulleted
Concept explainers
Videos
Textbook Question
Chapter 15.2, Problem 5E
The owner of Showtime Movie Theaters, Inc. would like to predict weekly gross revenue as a 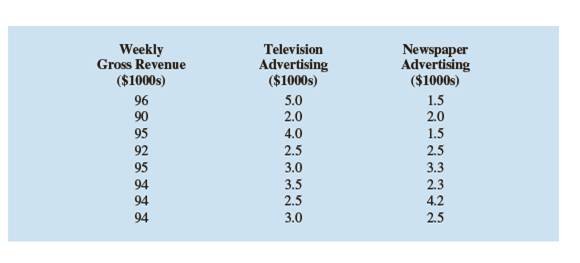
- Develop an estimated regression equation with the amount of television advertising as the independent variable.
- Develop an estimated regression equation with both television advertising and newspaper advertising as the independent variables.
- Is the estimated regression equation coefficient for television advertising expenditures the same in part (a) and in part (b)? Interpret the coefficient in each case.
- Predict weekly gross revenue for a week when $3500 is spent on television advertising and $1800 is spent on newspaper advertising?
Expert Solution & Answer
Want to see the full answer?
Check out a sample textbook solution
Students have asked these similar questions
Interpret the values of the regression coefficients (intercept and slope)in this context.
Note whether the intercept is meaningful (valid) for this data set.
what is the best predicted weight for a bear with 48 inches, and what is the regression equation
Why is the equation of the regression line for this scatter plot ?
Chapter 15 Solutions
Essentials of Modern Business Statistics with Microsoft Office Excel (Book Only)
Knowledge Booster


Learn more about
Need a deep-dive on the concept behind this application? Look no further. Learn more about this topic, statistics and related others by exploring similar questions and additional content below.Similar questions
- Does Table 2 represent a linear function? If so, finda linear equation that models the data.arrow_forwardWhat is regression analysis? Describe the process of performing regression analysis on a graphing utility.arrow_forwardFind the equation of the regression line for the following data set. x 1 2 3 y 0 3 4arrow_forward
- If your graphing calculator is capable of computing a least-squares sinusoidal regression model, use it to find a second model for the data. Graph this new equation along with your first model. How do they compare?arrow_forwardLife Expectancy The following table shows the average life expectancy, in years, of a child born in the given year42 Life expectancy 2005 77.6 2007 78.1 2009 78.5 2011 78.7 2013 78.8 a. Find the equation of the regression line, and explain the meaning of its slope. b. Plot the data points and the regression line. c. Explain in practical terms the meaning of the slope of the regression line. d. Based on the trend of the regression line, what do you predict as the life expectancy of a child born in 2019? e. Based on the trend of the regression line, what do you predict as the life expectancy of a child born in 1580?2300arrow_forward
arrow_back_ios
arrow_forward_ios
Recommended textbooks for you
 Functions and Change: A Modeling Approach to Coll...AlgebraISBN:9781337111348Author:Bruce Crauder, Benny Evans, Alan NoellPublisher:Cengage Learning
 Glencoe Algebra 1, Student Edition, 9780079039897...AlgebraISBN:9780079039897Author:CarterPublisher:McGraw Hill
 Algebra and Trigonometry (MindTap Course List)AlgebraISBN:9781305071742Author:James Stewart, Lothar Redlin, Saleem WatsonPublisher:Cengage Learning
 Trigonometry (MindTap Course List)TrigonometryISBN:9781305652224Author:Charles P. McKeague, Mark D. TurnerPublisher:Cengage Learning
Functions and Change: A Modeling Approach to Coll...
Algebra
ISBN:9781337111348
Author:Bruce Crauder, Benny Evans, Alan Noell
Publisher:Cengage Learning
Glencoe Algebra 1, Student Edition, 9780079039897...
Algebra
ISBN:9780079039897
Author:Carter
Publisher:McGraw Hill
Algebra and Trigonometry (MindTap Course List)
Algebra
ISBN:9781305071742
Author:James Stewart, Lothar Redlin, Saleem Watson
Publisher:Cengage Learning
Trigonometry (MindTap Course List)
Trigonometry
ISBN:9781305652224
Author:Charles P. McKeague, Mark D. Turner
Publisher:Cengage Learning
Correlation Vs Regression: Difference Between them with definition & Comparison Chart; Author: Key Differences;https://www.youtube.com/watch?v=Ou2QGSJVd0U;License: Standard YouTube License, CC-BY
Correlation and Regression: Concepts with Illustrative examples; Author: LEARN & APPLY : Lean and Six Sigma;https://www.youtube.com/watch?v=xTpHD5WLuoA;License: Standard YouTube License, CC-BY