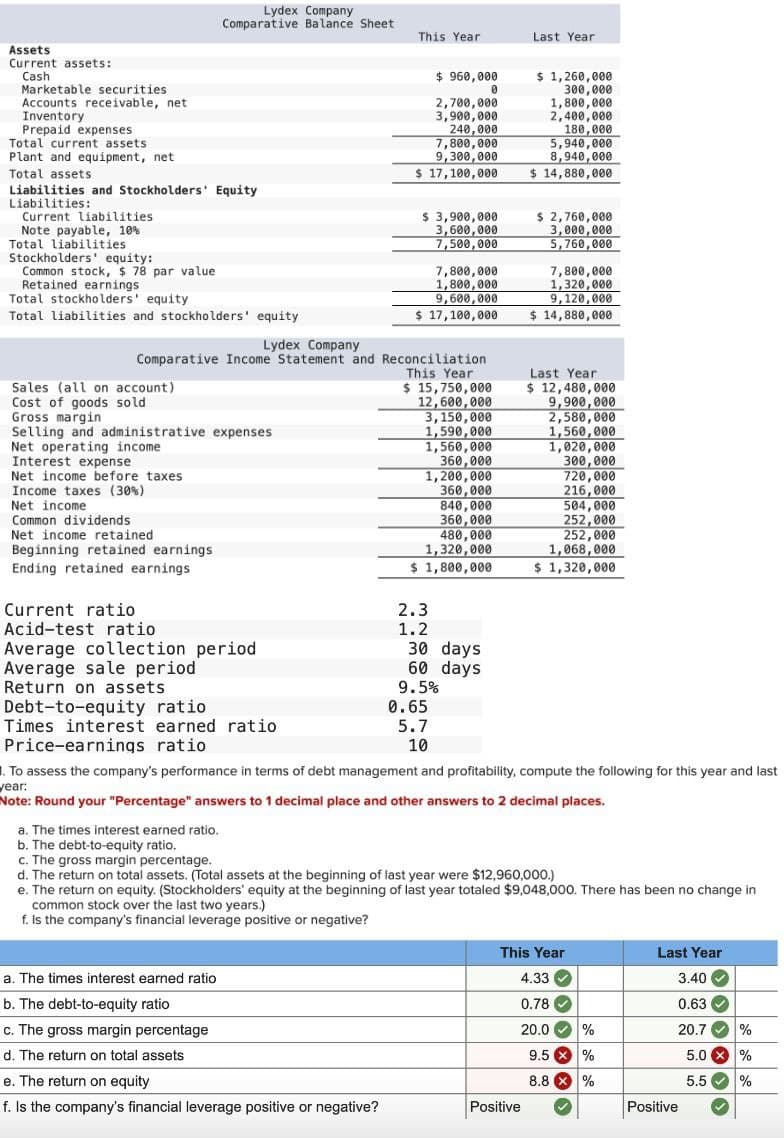
Lydex Company Comparative Balance Sheet This Year Last Year Assets Current assets: Cash Marketable securities Accounts receivable, net Inventory Prepaid expenses Total current assets Plant and equipment, net Total assets Liabilities and Stockholders' Equity Liabilities: Current liabilities Note payable, 10% Total liabilities Stockholders' equity: Common stock, $ 78 par value Retained earnings Total stockholders' equity Total liabilities and stockholders' equity Lydex Company $ 960,000 $1,260,000 0 2,700,000 3,900,000 240,000 7,800,000 9,300,000 $ 17,100,000 300,000 1,800,000 2,400,000 180,000 5,940,000 8,940,000 $ 14,880,000 $ 3,900,000 3,600,000 7,500,000 7,800,000 1,800,000 $ 2,760,000 3,000,000 5,760,000 7,800,000 1,320,000 9,600,000 9,120,000 $ 17,100,000 $ 14,880,000 Comparative Income Statement and Reconciliation Sales (all on account) Cost of goods sold Gross margin Selling and administrative expenses Net operating income Interest expense Net income before taxes Income taxes (30%) Net income Common dividends Net income retained Beginning retained earnings Ending retained earnings This Year $ 15,750,000 12,600,000 3,150,000 1,590,000 1,560,000 Last Year $ 12,480,000 9,900,000 2,580,000 1,560,000 1,020,000 360,000 300,000 1,200,000 720,000 360,000 216,000 840,000 504,000 360,000 252,000 480,000 1,320,000 252,000 1,068,000 $ 1,320,000 Current ratio Acid-test ratio Average collection period Return on assets Average sale period Debt-to-equity ratio. Times interest earned ratio $ 1,800,000 2.3 1.2 30 days 60 days 9.5% 0.65 5.7 10 Price-earnings ratio To assess the company's performance in terms of debt management and profitability, compute the following for this year and last rear: Note: Round your "Percentage" answers to 1 decimal place and other answers to 2 decimal places. a. The times interest earned ratio. b. The debt-to-equity ratio. c. The gross margin percentage. d. The return on total assets. (Total assets at the beginning of last year were $12,960,000.) e. The return on equity. (Stockholders' equity at the beginning of last year totaled $9,048,000. There has been no change in common stock over the last two years.) f. Is the company's financial leverage positive or negative? This Year Last Year a. The times interest earned ratio b. The debt-to-equity ratio c. The gross margin percentage d. The return on total assets e. The return on equity 4.33 3.40 0.78 0.63 20.0 % 20.7 % 9.5 % 5.0 % 8.8 % 5.5 % f. Is the company's financial leverage positive or negative? Positive Positive
Lydex Company Comparative Balance Sheet This Year Last Year Assets Current assets: Cash Marketable securities Accounts receivable, net Inventory Prepaid expenses Total current assets Plant and equipment, net Total assets Liabilities and Stockholders' Equity Liabilities: Current liabilities Note payable, 10% Total liabilities Stockholders' equity: Common stock, $ 78 par value Retained earnings Total stockholders' equity Total liabilities and stockholders' equity Lydex Company $ 960,000 $1,260,000 0 2,700,000 3,900,000 240,000 7,800,000 9,300,000 $ 17,100,000 300,000 1,800,000 2,400,000 180,000 5,940,000 8,940,000 $ 14,880,000 $ 3,900,000 3,600,000 7,500,000 7,800,000 1,800,000 $ 2,760,000 3,000,000 5,760,000 7,800,000 1,320,000 9,600,000 9,120,000 $ 17,100,000 $ 14,880,000 Comparative Income Statement and Reconciliation Sales (all on account) Cost of goods sold Gross margin Selling and administrative expenses Net operating income Interest expense Net income before taxes Income taxes (30%) Net income Common dividends Net income retained Beginning retained earnings Ending retained earnings This Year $ 15,750,000 12,600,000 3,150,000 1,590,000 1,560,000 Last Year $ 12,480,000 9,900,000 2,580,000 1,560,000 1,020,000 360,000 300,000 1,200,000 720,000 360,000 216,000 840,000 504,000 360,000 252,000 480,000 1,320,000 252,000 1,068,000 $ 1,320,000 Current ratio Acid-test ratio Average collection period Return on assets Average sale period Debt-to-equity ratio. Times interest earned ratio $ 1,800,000 2.3 1.2 30 days 60 days 9.5% 0.65 5.7 10 Price-earnings ratio To assess the company's performance in terms of debt management and profitability, compute the following for this year and last rear: Note: Round your "Percentage" answers to 1 decimal place and other answers to 2 decimal places. a. The times interest earned ratio. b. The debt-to-equity ratio. c. The gross margin percentage. d. The return on total assets. (Total assets at the beginning of last year were $12,960,000.) e. The return on equity. (Stockholders' equity at the beginning of last year totaled $9,048,000. There has been no change in common stock over the last two years.) f. Is the company's financial leverage positive or negative? This Year Last Year a. The times interest earned ratio b. The debt-to-equity ratio c. The gross margin percentage d. The return on total assets e. The return on equity 4.33 3.40 0.78 0.63 20.0 % 20.7 % 9.5 % 5.0 % 8.8 % 5.5 % f. Is the company's financial leverage positive or negative? Positive Positive

Cornerstones of Financial Accounting
4th Edition
ISBN:9781337690881
Author:Jay Rich, Jeff Jones
Publisher:Jay Rich, Jeff Jones
Chapter9: Long-term Liabilities
Section: Chapter Questions
Problem 103.1C: Leverage Cook Corporation issued financial statements at December 31, 2019, that include the...

Related questions
Question
Transcribed Image Text:Lydex Company
Comparative Balance Sheet
Assets
Current assets:
Cash
Marketable securities
Accounts receivable, net
Inventory
Prepaid expenses
Total current assets
Plant and equipment, net
Total assets
Liabilities and Stockholders' Equity
Liabilities:
Current liabilities
Note payable, 10%
Total liabilities
Stockholders' equity:
$ 1,260,000
This Year
Last Year
$960,000
0
2,700,000
3,900,000
240,000
7,800,000
9,300,000
$ 17,100,000
300,000
1,800,000
2,400,000
180,000
5,940,000
8,940,000
$ 14,880,000
$ 3,900,000
3,600,000
7,500,000
7,800,000
1,800,000
9,600,000
$ 2,760,000
3,000,000
5,760,000
7,800,000
1,320,000
9,120,000
Common stock, $ 78 par value
Retained earnings
Total stockholders' equity
Total liabilities and stockholders' equity
Lydex Company
$ 17,100,000
$ 14,880,000
Comparative Income Statement and Reconciliation
Sales (all on account)
Cost of goods sold
Gross margin
Selling and administrative expenses
Net operating income
Interest expense
Net income before taxes
Income taxes (30%)
Net income
Common dividends
Net income retained
Beginning retained earnings
Ending retained earnings
This Year
$ 15,750,000
12,600,000
3,150,000
Last Year
$ 12,480,000
9,900,000
2,580,000
1,590,000
1,560,000
1,560,000
1,020,000
360,000
300,000
1,200,000
720,000
360,000
216,000
840,000
504,000
360,000
252,000
480,000
252,000
1,320,000
1,068,000
$ 1,800,000
$ 1,320,000
Current ratio
2.3
Acid-test ratio
1.2
Average collection period
Average sale period
Return on assets
30 days
60 days
9.5%
Debt-to-equity ratio
0.65
Times interest earned ratio
5.7
10
Price-earnings ratio
1. To assess the company's performance in terms of debt management and profitability, compute the following for this year and last
year:
Note: Round your "Percentage" answers to 1 decimal place and other answers to 2 decimal places.
a. The times interest earned ratio.
b. The debt-to-equity ratio.
c. The gross margin percentage.
d. The return on total assets. (Total assets at the beginning of last year were $12,960,000.)
e. The return on equity. (Stockholders' equity at the beginning of last year totaled $9,048,000. There has been no change in
common stock over the last two years.)
f. Is the company's financial leverage positive or negative?
a. The times interest earned ratio
b. The debt-to-equity ratio
c. The gross margin percentage
d. The return on total assets
e. The return on equity
f. Is the company's financial leverage positive or negative?
This Year
Last Year
4.33
3.40
0.78
0.63
20.0
%
20.7
%
9.5%
5.0 %
Positive
8.8 %
5.5
%
Positive
Expert Solution
This question has been solved!
Explore an expertly crafted, step-by-step solution for a thorough understanding of key concepts.

Step by step
Solved in 3 steps with 2 images

Knowledge Booster


Learn more about
Need a deep-dive on the concept behind this application? Look no further. Learn more about this topic, accounting and related others by exploring similar questions and additional content below.Recommended textbooks for you
Cornerstones of Financial Accounting
Accounting
ISBN:
9781337690881
Author:
Jay Rich, Jeff Jones
Publisher:
Cengage Learning

Managerial Accounting
Accounting
ISBN:
9781337912020
Author:
Carl Warren, Ph.d. Cma William B. Tayler
Publisher:
South-Western College Pub

Intermediate Accounting: Reporting And Analysis
Accounting
ISBN:
9781337788281
Author:
James M. Wahlen, Jefferson P. Jones, Donald Pagach
Publisher:
Cengage Learning
Cornerstones of Financial Accounting
Accounting
ISBN:
9781337690881
Author:
Jay Rich, Jeff Jones
Publisher:
Cengage Learning
Managerial Accounting
Accounting
ISBN:
9781337912020
Author:
Carl Warren, Ph.d. Cma William B. Tayler
Publisher:
South-Western College Pub
Intermediate Accounting: Reporting And Analysis
Accounting
ISBN:
9781337788281
Author:
James M. Wahlen, Jefferson P. Jones, Donald Pagach
Publisher:
Cengage Learning

Fundamentals Of Financial Management, Concise Edi…
Finance
ISBN:
9781337902571
Author:
Eugene F. Brigham, Joel F. Houston
Publisher:
Cengage Learning

Survey of Accounting (Accounting I)
Accounting
ISBN:
9781305961883
Author:
Carl Warren
Publisher:
Cengage Learning