Group A: 18.7 20.6 20.7 19.7 19.9 19.4 20.2 21.6 18.8 14.1 21.6 16.2 21.7 20.8 19.3 21.3 19.9 20.8 23.2 Group B: 15.2 36.2 27.5 4.7 24.5 29.4 25.9 62.8 Some summary statistics to help you: y s n Group A: Group B: 19.921 2.0457 19 28.275 16.9169 8 Is there a difference in estrogen levels? (Note: d.f. = 7.0864 for Welch's t-test). Use α = 0.05. Make sure you give Ho and H₁ (symbols are okay), and clearly write out your conclusion. 4) Repeat (3), but this time assume equal variances (i.e., use the classic t-test). Use the same level of a you used before. Make sure you give Ho and H₁ (symbols are okay), and clearly write out your conclusion.
Group A: 18.7 20.6 20.7 19.7 19.9 19.4 20.2 21.6 18.8 14.1 21.6 16.2 21.7 20.8 19.3 21.3 19.9 20.8 23.2 Group B: 15.2 36.2 27.5 4.7 24.5 29.4 25.9 62.8 Some summary statistics to help you: y s n Group A: Group B: 19.921 2.0457 19 28.275 16.9169 8 Is there a difference in estrogen levels? (Note: d.f. = 7.0864 for Welch's t-test). Use α = 0.05. Make sure you give Ho and H₁ (symbols are okay), and clearly write out your conclusion. 4) Repeat (3), but this time assume equal variances (i.e., use the classic t-test). Use the same level of a you used before. Make sure you give Ho and H₁ (symbols are okay), and clearly write out your conclusion.

MATLAB: An Introduction with Applications
6th Edition
ISBN:9781119256830
Author:Amos Gilat
Publisher:Amos Gilat
Chapter1: Starting With Matlab
Section: Chapter Questions
Problem 1P

Related questions
Question
100%
Answer number 4 using the information right above it
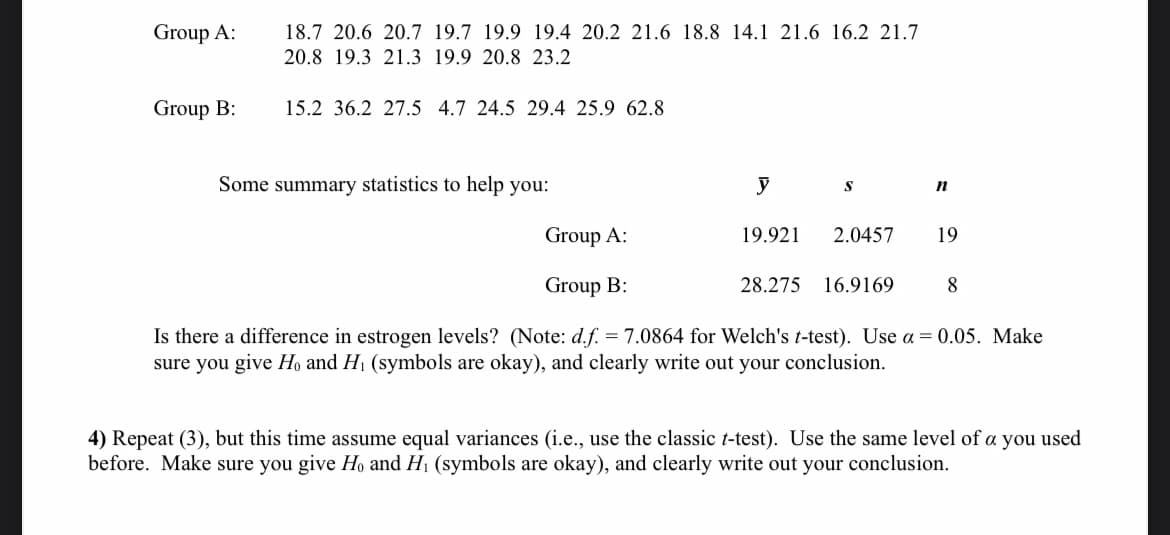
Transcribed Image Text:Group A:
Group B:
18.7 20.6 20.7 19.7 19.9 19.4 20.2 21.6 18.8 14.1 21.6 16.2 21.7
20.8 19.3 21.3 19.9 20.8 23.2
15.2 36.2 27.5 4.7 24.5 29.4 25.9 62.8
Some summary statistics to help you:
y
S
n
Group A:
Group B:
19.921 2.0457
19
28.275 16.9169
8
Is there a difference in estrogen levels? (Note: d.f. = 7.0864 for Welch's t-test). Use α = 0.05. Make
sure you give Ho and H₁ (symbols are okay), and clearly write out your conclusion.
4) Repeat (3), but this time assume equal variances (i.e., use the classic t-test). Use the same level of a you used
before. Make sure you give Ho and H₁ (symbols are okay), and clearly write out your conclusion.
Expert Solution
This question has been solved!
Explore an expertly crafted, step-by-step solution for a thorough understanding of key concepts.

This is a popular solution!

Trending now
This is a popular solution!

Step by step
Solved in 3 steps with 4 images

Recommended textbooks for you
MATLAB: An Introduction with Applications
Statistics
ISBN:
9781119256830
Author:
Amos Gilat
Publisher:
John Wiley & Sons Inc

Probability and Statistics for Engineering and th…
Statistics
ISBN:
9781305251809
Author:
Jay L. Devore
Publisher:
Cengage Learning

Statistics for The Behavioral Sciences (MindTap C…
Statistics
ISBN:
9781305504912
Author:
Frederick J Gravetter, Larry B. Wallnau
Publisher:
Cengage Learning
MATLAB: An Introduction with Applications
Statistics
ISBN:
9781119256830
Author:
Amos Gilat
Publisher:
John Wiley & Sons Inc
Probability and Statistics for Engineering and th…
Statistics
ISBN:
9781305251809
Author:
Jay L. Devore
Publisher:
Cengage Learning
Statistics for The Behavioral Sciences (MindTap C…
Statistics
ISBN:
9781305504912
Author:
Frederick J Gravetter, Larry B. Wallnau
Publisher:
Cengage Learning

Elementary Statistics: Picturing the World (7th E…
Statistics
ISBN:
9780134683416
Author:
Ron Larson, Betsy Farber
Publisher:
PEARSON

The Basic Practice of Statistics
Statistics
ISBN:
9781319042578
Author:
David S. Moore, William I. Notz, Michael A. Fligner
Publisher:
W. H. Freeman

Introduction to the Practice of Statistics
Statistics
ISBN:
9781319013387
Author:
David S. Moore, George P. McCabe, Bruce A. Craig
Publisher:
W. H. Freeman