Consider the competitive market for steel. Assume that, regardless of how many firms are in the industry, every firm in the industry is identical and faces the marginal cost (MC), average total cost (ATC), and average variable cost (AVC) curves shown on the following graph. (?) 100 90 80 70 60 50 40 ATC 30 20 MCO AVC 10 + 5 10 15 20 25 30 35 40 45 50 QUANTITY (Thousands of tons) The following diagram shows the market demand for steel. Use the orange points (square symbol) to plot the initial short-run industry supply curve when there are 20 firms in the market. (Hint: You can disregard the portion of the supply curve that corresponds to prices where there is no output since this is the industry supply curve.) Next, use the purple points (diamond symbol) to plot the short-run industry supply curve when there are 30 firms. Finally, use the green points (triangle symbol) to plot the short-run industry supply curve when there are 40 firms. 100 90 Supply (20 firms) 80 70 E 60 Supply (30 firms) 50 40 Supply (40 firms) Demand 30 20 10 125 250 375 500 625 750 875 1000 1125 1250 QUANTITY (Thousands of tons) If there were 20 firms in this market, the short-run equilibrium price of steel would be S per ton. At that price, firms in this industry would . Therefore, in the long run, firms would v the steel market. ▼ Because you know that competitive firms earn v economic profit in the long run, you know the long-run equilibrium price must be $ |per ton. From the graph, you can see that this means there will be v firms operating in the steel industry in long-run equilibrium. True or False: Assuming implicit costs are positive, each of the firms operating in this industry in the long run earns negative accounting profit. O True O False PRICE (Dollars per ton) COSTS (Dollars perton)
Consider the competitive market for steel. Assume that, regardless of how many firms are in the industry, every firm in the industry is identical and faces the marginal cost (MC), average total cost (ATC), and average variable cost (AVC) curves shown on the following graph. (?) 100 90 80 70 60 50 40 ATC 30 20 MCO AVC 10 + 5 10 15 20 25 30 35 40 45 50 QUANTITY (Thousands of tons) The following diagram shows the market demand for steel. Use the orange points (square symbol) to plot the initial short-run industry supply curve when there are 20 firms in the market. (Hint: You can disregard the portion of the supply curve that corresponds to prices where there is no output since this is the industry supply curve.) Next, use the purple points (diamond symbol) to plot the short-run industry supply curve when there are 30 firms. Finally, use the green points (triangle symbol) to plot the short-run industry supply curve when there are 40 firms. 100 90 Supply (20 firms) 80 70 E 60 Supply (30 firms) 50 40 Supply (40 firms) Demand 30 20 10 125 250 375 500 625 750 875 1000 1125 1250 QUANTITY (Thousands of tons) If there were 20 firms in this market, the short-run equilibrium price of steel would be S per ton. At that price, firms in this industry would . Therefore, in the long run, firms would v the steel market. ▼ Because you know that competitive firms earn v economic profit in the long run, you know the long-run equilibrium price must be $ |per ton. From the graph, you can see that this means there will be v firms operating in the steel industry in long-run equilibrium. True or False: Assuming implicit costs are positive, each of the firms operating in this industry in the long run earns negative accounting profit. O True O False PRICE (Dollars per ton) COSTS (Dollars perton)

Essentials of Economics (MindTap Course List)
8th Edition
ISBN:9781337091992
Author:N. Gregory Mankiw
Publisher:N. Gregory Mankiw
Chapter12: The Cost Of Production
Section: Chapter Questions
Problem 4CQQ

Related questions

Question

Transcribed Image Text:Consider the competitive market for steel. Assume that, regardless of how many firms are in the industry, every firm in the industry is identical and
faces the marginal cost (MC), average total cost (ATC), and average variable cost (AVC) curves shown on the following graph.
(?)
100
90
80
70
60
50
40
ATC
30
20
MCO
AVC
10
+
5
10
15
20
25 30
35
40
45
50
QUANTITY (Thousands of tons)
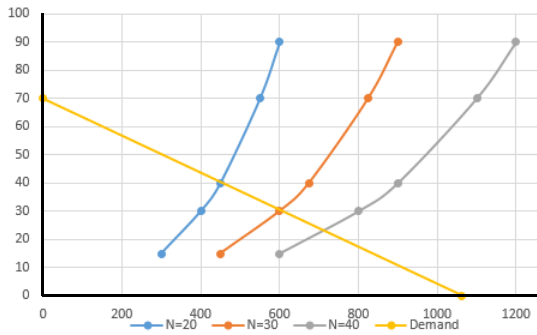
The following diagram shows the market demand for steel.
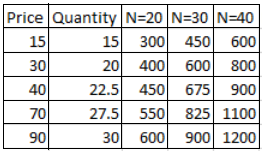
Use the orange points (square symbol) to plot the initial short-run industry supply curve when there are 20 firms in the market. (Hint: You can
disregard the portion of the supply curve that corresponds to prices where there is no output since this is the industry supply curve.) Next, use the
purple points (diamond symbol) to plot the short-run industry supply curve when there are 30 firms. Finally, use the green points (triangle symbol) to
plot the short-run industry supply curve when there are 40 firms.
100
90
Supply (20 firms)
80
70
E 60
Supply (30 firms)
50
40
Supply (40 firms)
Demand
30
20
10
125
250
375
500
625
750 875 1000 1125 1250
QUANTITY (Thousands of tons)
If there were 20 firms in this market, the short-run equilibrium price of steel would be S
per ton. At that price, firms in this industry would
. Therefore, in the long run, firms would
v the steel market.
▼
Because you know that competitive firms earn
v economic profit in the long run, you know the long-run equilibrium price must be
$
|per ton. From the graph, you can see that this means there will be
v firms operating in the steel industry in long-run equilibrium.
True or False: Assuming implicit costs are positive, each of the firms operating in this industry in the long run earns negative accounting profit.
O True
O False
PRICE (Dollars per ton)
COSTS (Dollars perton)
Expert Solution
Step 1
Below is the table:

Trending now
This is a popular solution!

Step by step
Solved in 2 steps with 2 images

Knowledge Booster


Learn more about
Need a deep-dive on the concept behind this application? Look no further. Learn more about this topic, economics and related others by exploring similar questions and additional content below.Recommended textbooks for you
Essentials of Economics (MindTap Course List)
Economics
ISBN:
9781337091992
Author:
N. Gregory Mankiw
Publisher:
Cengage Learning

Managerial Economics: A Problem Solving Approach
Economics
ISBN:
9781337106665
Author:
Luke M. Froeb, Brian T. McCann, Michael R. Ward, Mike Shor
Publisher:
Cengage Learning

Economics (MindTap Course List)
Economics
ISBN:
9781337617383
Author:
Roger A. Arnold
Publisher:
Cengage Learning
Essentials of Economics (MindTap Course List)
Economics
ISBN:
9781337091992
Author:
N. Gregory Mankiw
Publisher:
Cengage Learning
Managerial Economics: A Problem Solving Approach
Economics
ISBN:
9781337106665
Author:
Luke M. Froeb, Brian T. McCann, Michael R. Ward, Mike Shor
Publisher:
Cengage Learning
Economics (MindTap Course List)
Economics
ISBN:
9781337617383
Author:
Roger A. Arnold
Publisher:
Cengage Learning


