Consider the population described by the probability distribution shown below. The random variable is observed twice with independent observations. X P(x) 3,3 3,4 3,5 3,6 4,3 4,4 4,5 4,6 Full data set 0.06 0.09 0.09 0.06 0.06 0.06 3 0.3 4 0.3 5 0.2 6 0.2 Sample Probability 0.09 0.09 Sample 5,3 5,4 5,5 5,6 6,3 6,4 6,5 6,6 Probability 0.06 0.06 0.04 0.04 0.06 0.06 0.04 0.04 a. Complete the sampling distribution table. Type the x values in ascending order. 3.5 4 X Probability 0.09 (Type exact answers in simplified form.) 0.24 0.16 5.5 6
Consider the population described by the probability distribution shown below. The random variable is observed twice with independent observations. X P(x) 3,3 3,4 3,5 3,6 4,3 4,4 4,5 4,6 Full data set 0.06 0.09 0.09 0.06 0.06 0.06 3 0.3 4 0.3 5 0.2 6 0.2 Sample Probability 0.09 0.09 Sample 5,3 5,4 5,5 5,6 6,3 6,4 6,5 6,6 Probability 0.06 0.06 0.04 0.04 0.06 0.06 0.04 0.04 a. Complete the sampling distribution table. Type the x values in ascending order. 3.5 4 X Probability 0.09 (Type exact answers in simplified form.) 0.24 0.16 5.5 6
Calculus For The Life Sciences
2nd Edition
ISBN:9780321964038
Author:GREENWELL, Raymond N., RITCHEY, Nathan P., Lial, Margaret L.
Publisher:GREENWELL, Raymond N., RITCHEY, Nathan P., Lial, Margaret L.
Chapter12: Probability
Section12.4: Discrete Random Variables; Applications To Decision Making
Problem 4E
Related questions
Question
100%

Transcribed Image Text:Consider the population described by the probability distribution shown below. The random variable is observed twice with independent observations.
3,3 3,4 3,5 3,6 4,3 4,4 4,5 4,6 Full data set
0.09
0.06
0.06
0.09
0.09 0.06 0.06
X p(x)
<3 4 5 6
0.3
0.3
0.2
0.2
Sample
Probability 0.09
Sample 5,3 5,4 5,5 5,6 6,3 6,4 6,5 6,6
Probability 0.06 0.06 0.04 0.04 0.06 0.06 0.04 0.04
a. Complete the sampling distribution table. Type the x values in ascending order.
3.5
4
X
Probability 0.09
(Type exact answers in simplified form.)
0.24 0.16
5.5
6
Expert Solution
This question has been solved!
Explore an expertly crafted, step-by-step solution for a thorough understanding of key concepts.
Step by step
Solved in 2 steps with 2 images

Follow-up Questions
Read through expert solutions to related follow-up questions below.
Follow-up Question
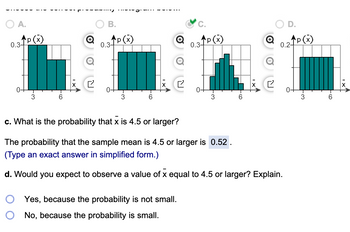
Please do d)

Transcribed Image Text:O A.
0.3-
`p (x)
р
3
6
Q
↑P(x)
0.3-
0+
3
6
0.3 P(x)
Yes, because the probability is not small.
No, because the probability is small.
3
0.2-
c. What is the probability that x is 4.5 or larger?
The probability that the sample mean is 4.5 or larger is 0.52.
(Type an exact answer in simplified form.)
d. Would you expect to observe a value of x equal to 4.5 or larger? Explain.
p(x)
3
Solution
Follow-up Question

Transcribed Image Text:b. Construct a probability histogram for the sampling distribution of X.
Choose the correct probability histogram below.
A.
B.
0.3 P(x)
3
6
17
0.3-
p(x)
ott
3
C.
0.3-
p(x)
-3
6
D.
0.2-
`p (x)
0+
3
Solution
Recommended textbooks for you

Calculus For The Life Sciences
Calculus
ISBN:
9780321964038
Author:
GREENWELL, Raymond N., RITCHEY, Nathan P., Lial, Margaret L.
Publisher:
Pearson Addison Wesley,

Calculus For The Life Sciences
Calculus
ISBN:
9780321964038
Author:
GREENWELL, Raymond N., RITCHEY, Nathan P., Lial, Margaret L.
Publisher:
Pearson Addison Wesley,